Tool Summary
Locations:
Info tab >  (Tool Summary)
The Tool Summary command button opens the Tool Summary panel enabling you to visually display which tools are used and when throughout the machining process.
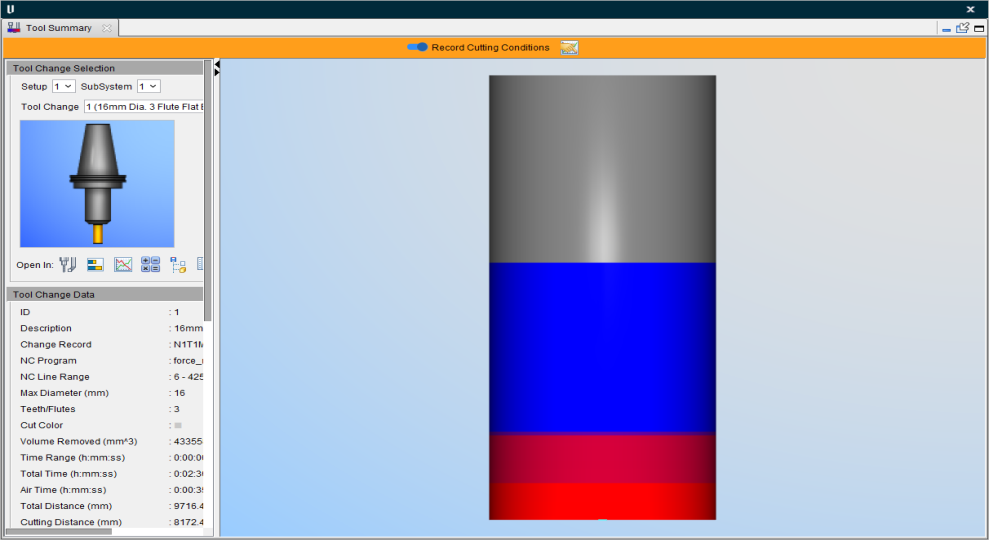
Record Cutting Conditions — Toggle on (switch to the right) to control when cutting condition data is recorded and displayed in the Graphs window. When turned on, the color bar changes from black to orange and all subsequent cutting condition data is recorded (regardless of which graphs are displayed).
![]() — Opens the Preferences window, Graphs tab, enabling you to set various Graphs preferences for your project.
— Opens the Preferences window, Graphs tab, enabling you to set various Graphs preferences for your project.
Tool Change Selection group
Setup — Use this pulldown menu to select which setup to use.
Subsystem — Use this pulldown menu to select which subsystem to use.
Tool Change — Use this pulldown menu to select which tool change is active.
Tool Display Area — Shows a model of the currently selected tool.
Open In icons — This generates a popup menu of options where the tool can be viewed in more detail. Current options include: Tool Manager, Tool Use, Graphs, Optimization Savings Calculator, and NC Program. Click on any of these links to be navigated to the Help topic that explains these features in more detail.
Tool Change Data group
The info in this group displays all the uneditable information about the tool that is pulled from the Tool Manager.
ID — Displays the Tool ID Number.
Description — Displays the Tool Description.
Change Record — Displays where the Tool Change occurred.
NC Program — Displays the filename of the active NC Program.
NC Line Range — Displays the lines where the tool is active during the NC Program.
Max Diameter — Displays the longest diameter of the tool in millimeters.
Teeth/Flutes — Displays the number of teeth or flutes on the tool.
Cut Color — Shows the color that is associated with this tool in the Tool Manager.
Volume Removed — Displays the total volume of material removed in millimeters cubed.
Time Range — Displays the time span where the tool is in use in the form hh ss.
ss.
Total Time — Displays the total length of time the tool is in use in the form hhss.
Air Time — Displays the total amount of time the tool is in the air in the form hhss.
Total Distance — Displays the distance the tool traveled during machining in millimeters.
Cutting Distance — Displays the amount of distance that is cut by the tool in millimeters.
Feed Rate — Displays the tool feed rate in millimeters per minute.
Max Cut Feed Rate — Displays the maximum feed rate in millimeters per minute.
Spindle Speed — Displays the minimum and maximum spindle speeds in rotations per minute.
Cutting Element Data group
The info in this group displays cutting data over the course of machining. It updates depending on which layer of the tool is selected.
Cutting Element — This field displays which cutting element out of the total number of cutting elements is currently selected. You can manually edit the field to select a different element. You can also use the ![]() and
and ![]() icons to respectively decrease or increase the selected cutting element incrementally.
icons to respectively decrease or increase the selected cutting element incrementally.
 Mouse Pick icon — Toggle this icon on (highlighted) to enable mouse picking of cutting elements. So long as it is active, you can click in the Graphics Area to select specific cutting elements.
Diameter — Displays the diameter in millimeters of the selected cutting element.
Z Location — Displays the location of the cutting element on the Z axis in millimeters.
Element Length — Displays the length of the cutting element in millimeters.
Cutting Time — Displays the total cutting time of the cutting element in hhss.
Cutting Distance — Displays the total cutting distance in millimeters.
Chip Thickness — Displays the average, minimum, and maximum chip thickness across the cutting element in millimeters.
Angular Contact — Displays the average, minimum, and maximum angled contact of the cutting element in degrees.
Surface Speed — Displays the average, minimum, and maximum surface speed in meters per minute.
Display Options group
Contact Data Type — Use this pulldown menu to select various display options including Cutting Time, Cutting Distance, Chip Thickness, Angular Contact, and Surface Speed. Which setting you pick will control the display of the Graphics Area.
Statistical Type — Use this pulldown menu to select between Average, Minimum, and Maximum options. This option is not available for Cutting Time and Cutting Distance Contact Data Types.
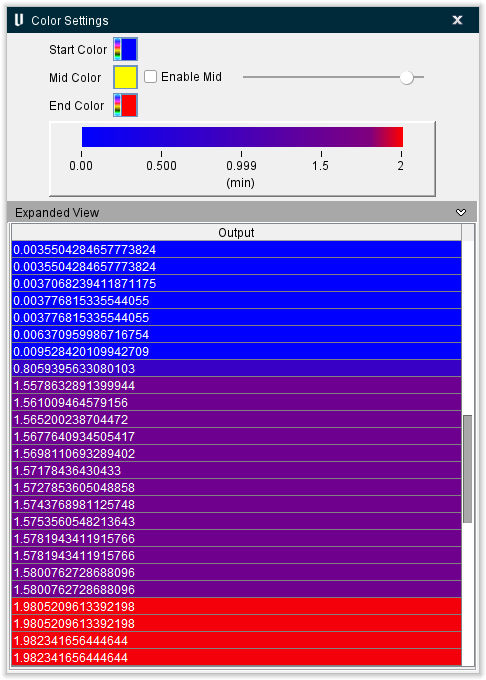
![]() Color Settings — Opens the Color Settings window enabling you to designate which colors will be displayed in Graphics Area.
Color Settings — Opens the Color Settings window enabling you to designate which colors will be displayed in Graphics Area.
-
Start Color, Mid Color, and End Color — Use these color palette icons to pick the color your tool will be displayed as at the start of its machining and the end of its machining. The Mid Color option also allows for a gradient to be used to bridge the Start and End Colors but this option is only active when the adjoining Enable Mid checkbox is toggled on (checked). The Color Display Bar beneath these options will display the approximate time into usage where each color will start appearing.
-
Color Slider — This slider can be used to adjust how much of the start and end colors are present in the Graphics Area. If the slider is all the way to the left, the start color will be minimized and the end color maximized. If the slider is all the way to the right, the end color will be minimized and the start color will be maximized. If the slider is in the middle, the colors will be balanced.
-
Expanded View — This feature contains every single movement of the tool and each movement will be color coded according to the colors you picked earlier.
Enable SMR Min Value — Toggle this feature on (checked) to apply a minimum rate to the Graphics Display.
Enable SMR Max Value — Toggle this feature on (checked) to apply a maximum rate to the Graphics Display.
Color Display Bar — This feature displays the approximate time into usage where each color will start appearing as selected in the Color Settings window.
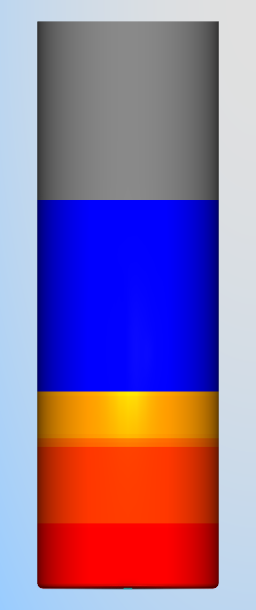
Graphics Area
The Graphics Area shows the selected tool along with its wear and tear from usage over time. In the below example, blue is used as the start color and shows wear the least wear and tear happens while red is used as the end color and shows where the most wear and tear happens. Gray is used to mark locations where no wear and tear happens.
You can hover over any cutting element and select it by left-clicking with the mouse. The selected cutting element will then change what is displayed in the Cutting Element Data group. You can zoom out from the view by scrolling up with the mouse wheel or zoom in by scrolling down with the mouse wheel.
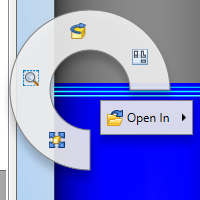
Right-click on a selected cutting element to generate the following Right Mouse Button wheel and menu:
Fit Selected — Adjusts the view so that tool fits exactly within the displayed area.
Zoom to Box — Changes the cursor to a magnifying glass. By holding down the left mouse button and dragging, you can then select a specific area to zoom into. This functionality is also available without clicking in the RMB menu wheel but simply clicking and dragging a bounding box with the mouse wheel.
Reverse — Reverse the view.
Snap to Orthogonal View — Adjust the view of the tool to be displayed orthogonally.
Open In — use this dropdown menu to open the selected layer in one of the following options: Tool Manager, Tool Use, Tool Summary, Optimization Savings Calculator, Project Tree, and NC Program.