Probe Programming
Locations:
Utilities ribbon > Probe > Probe Programming 
The "end product" of Vericut's Probe Programming functionality is to generate probe cycles generate an NC program (.mcd file) using the probe cycles generated. The intention is to run the probing program with the part still on the CNC machine to verify what has just been cut correctly to the design print to ensure that the job is proceeding as intended. If a discrepancy is found, no additional time will be wasted on subsequent machining. This goal can be reached quickly if the probing is performed on the machine and by the machine, using one or more probes.
Following are the icons and a brief description of their intended use.
| Icon | Description |
|---|---|
| Clears the table, ready to start a new inspection sequence. | |
| Prompts for and opens an existing inspection sequence file. Such files typically have the extension ".VcInspect". | |
| Saves the current inspection sequence to a file. You may be prompted to select a file name if the current sequence was not derived from an existing file. There is also a "Save As" option in the dropdown menu which is accessed by clicking the down arrow next to Save File. | |
| Enables you to easily open one of the ten most recently used files. | |
| Enables you to select a Wall Thickness point. | |
| Enables you to select a Floor Thickness point. | |
| Enables you to select a Hole Diameter point. | |
| Enables you to select a Distance point. | |
| Enables you to select an Angle point. | |
| Enables you to select a Position point. | |
| Enables you to select a Hole Depth point. | |
| Enables you to select a Radius point. | |
| Allows you to re-position the selected row's symbol in a workpiece view. The row's dimension will be recalculated, and if the tolerance value was automatically generated, it will also be updated. | |
| Restores the default tolerances. | |
| Deletes the selected row from the table. | |
| Refreshes all the rows. This is equivalent to using the re-positioning icon, |
|
| Opens another dialog to assist in identifying the features on the stock that were cut by each tool. | |
| Causes the Probe Programming dialog to be displayed, and transfers any features that have "Probe" as their measuring instrument, to the extra dialog. | |
| Enables you to change the color of the foreground. | |
| Enables you to change the color of a selected workpiece. |
Using Probe Programming
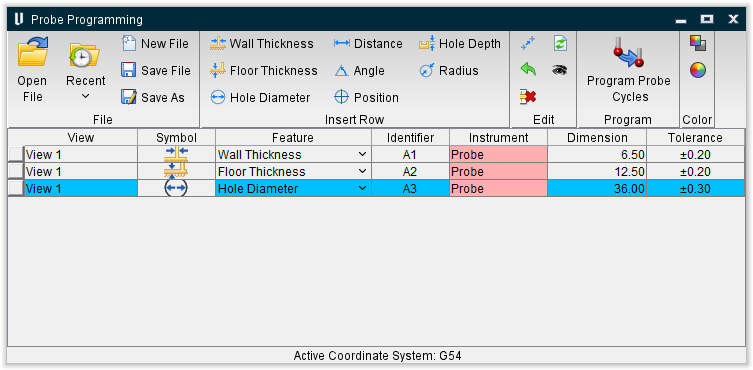
To explain Probe Programming we will start with a simple example of a simulation where probing is needed to perform checks to what has been machined. In this situation there are two wall thickness measurements and a hole diameter that need to be probed. Note that the active coordinate system is "Machine Origin".
Run the complete simulation.
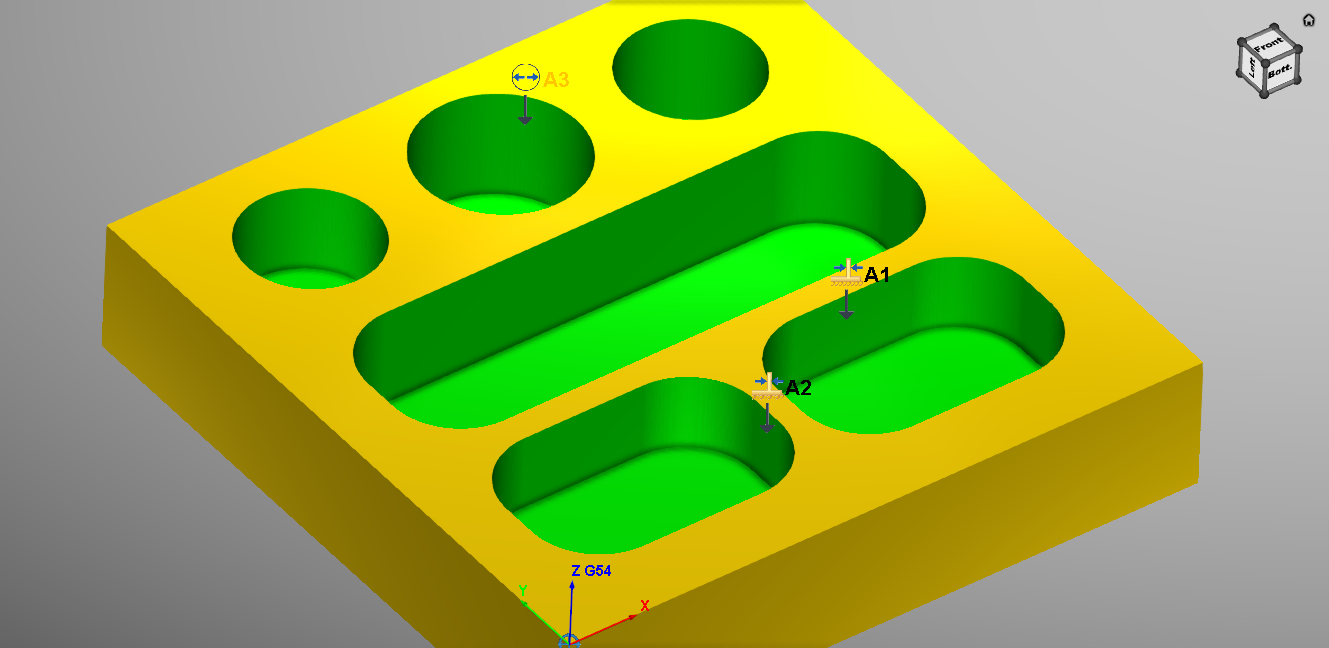
You will select the Wall Thickness icon and select in the approximate area shown above. These locations will be the approximate area of where the probe will measure the part.
When finished select the Hole Diameter icon and select the approximate area shown above. You should now have 3 lines in the Probe Programming window.
Next we use the ![]() (Program probe cycles) icon to request the Inspection Programming dialog. Before we see it, we will be prompted to select a post-processor file, which typically has the extension ".VcPost". For this explanation we shall use a post-processor developed for Renishaw probe cycles on a Fanuc controller. The name of the file is "RenishawFanuc.VcPost". This file can be found in the \samples folder of your Vericut installation.
(Program probe cycles) icon to request the Inspection Programming dialog. Before we see it, we will be prompted to select a post-processor file, which typically has the extension ".VcPost". For this explanation we shall use a post-processor developed for Renishaw probe cycles on a Fanuc controller. The name of the file is "RenishawFanuc.VcPost". This file can be found in the \samples folder of your Vericut installation.
You can view the post-processor content, and edit it if you wish, by clicking the ![]() (Edit post-processor) icon. Development of a post-processor for probe cycle programming is documented elsewhere (refer to Vericut Post Processor Help section of Vericut Development Tools, located in the Vericut Help Library).
(Edit post-processor) icon. Development of a post-processor for probe cycle programming is documented elsewhere (refer to Vericut Post Processor Help section of Vericut Development Tools, located in the Vericut Help Library).
Enter a /path/filename for the probe NC program to be created in the Probe program text field, or click on the  (Browse for probe program) icon and use the Probe program file selection window to specify the /path/filename. Note that a default name is supplied for the G-Code program that will be generated, using the current inspection file name with the ".VcInspect" extension replaced by "-Probe.mcd" if you do not specify one.

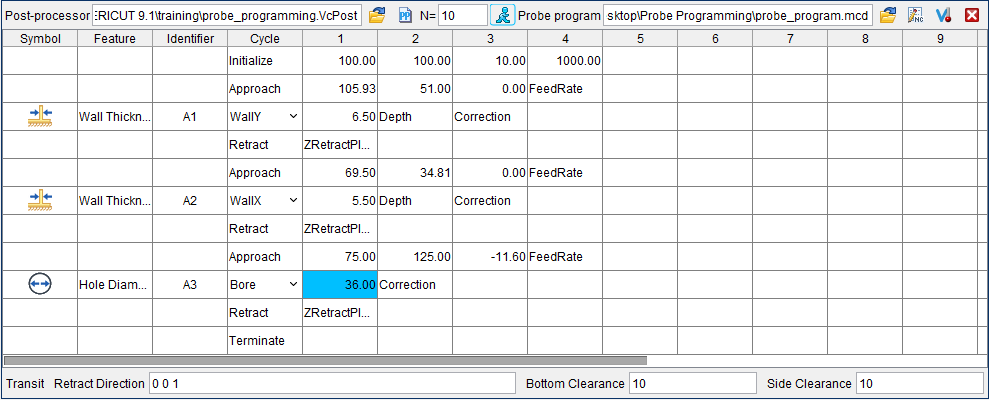
When the Inspection Programming window opens it will display a table with white and pink cells. The pink cells in the table represent mandatory parameters that must be entered. Once the mandatory pink cells contain numeric values, the color disappears. Optional parameters are not colored initially. You can hover over any parameter cell to see the parameter name displayed as a tool-tip, even after it contains a numeric value.
The numbered columns in the table contain the names of parameters for the cycles. Each probe cycle row is preceded by an "Approach" row, and followed by a "Retract" row. The table starts with an "Initialization" row and ends with a "Termination" row. All of these rows can have associated parameters in the numbered columns.
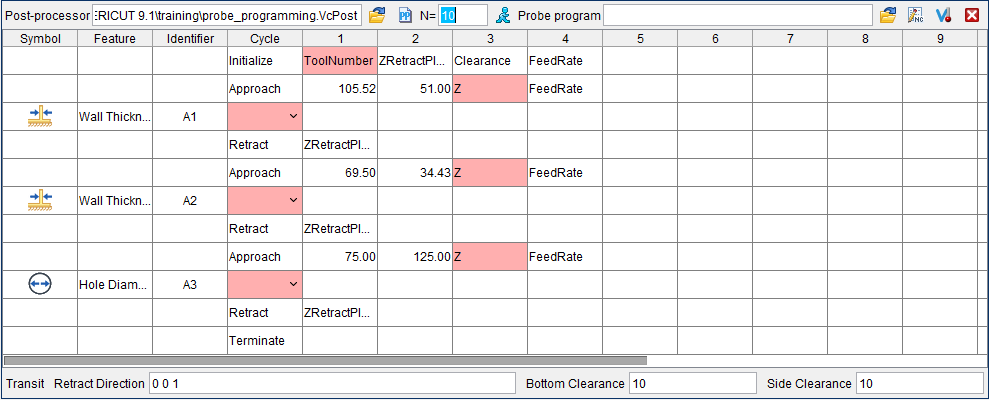
Enter the following values in columns 1-4 starting with the pink ToolNumber cell.
-
ToolNumber = 100
-
ZRetractPlane - 100
-
Clearance = 10
-
Feedrate = 1000
Because the two webs are in the machine's YZ plane, we can use a "WallX" cycle to measure each of them. Double-click on one of the pink cells and select the cycle name from the drop-down list. Then repeat for the second feature. The cycle names presented in the drop-down lists are defined in the post-processor, and will vary from one target machine to another.
Continue entering values in the pink fields as shown below. Notice that as some parameters are entered in pink fields, other pink fields appear that will require values to be entered.
When finished click the ![]() (Run post to generate program) icon to run the post-processor and create the Probe NC program.
(Run post to generate program) icon to run the post-processor and create the Probe NC program.
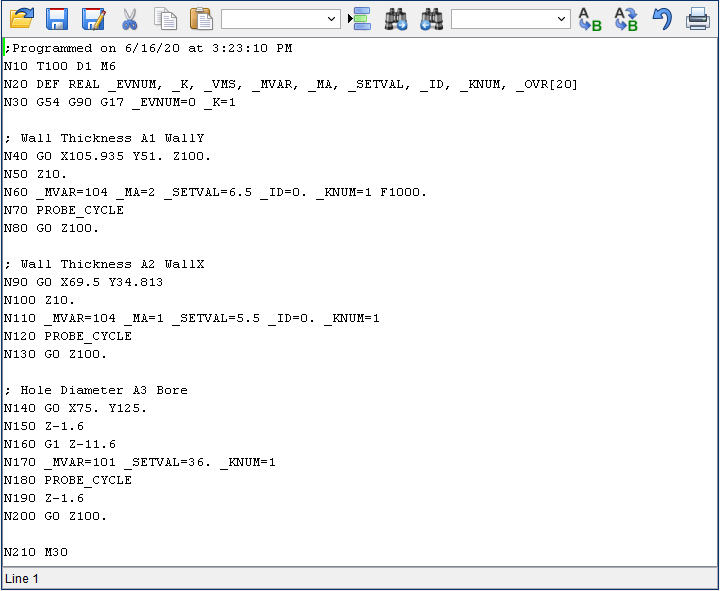
When the post-processor finishes processing, the resulting G-Code program displays in the NC program in an editor window enabling you to view and edit if necessary.
You can also view, or edit, the Probe NC program at any time by clicking on the ![]() (Edit probe program) icon to display the probe program in the NC program editor window.
(Edit probe program) icon to display the probe program in the NC program editor window.
The comments in the probe NC program are derived from the second, third and fourth columns of the table for each feature. Note that the first block number in the program comes from the  entry box at the top of the Inspection Programming dialog.
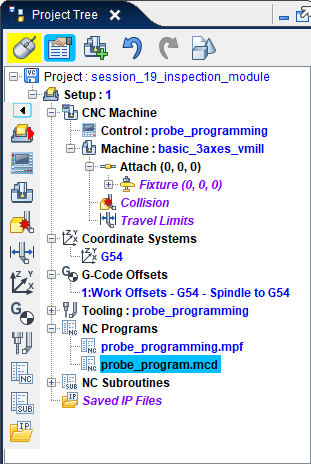
You can simulate the probe cycle program by clicking on ![]() (Simulate probe program) in the Inspection Programming window. This will append the new program's file name to the end of the NC Programs list in the Project Tree. It will also make all other NC programs in the list "inactive".
(Simulate probe program) in the Inspection Programming window. This will append the new program's file name to the end of the NC Programs list in the Project Tree. It will also make all other NC programs in the list "inactive".
You should then be able to click on Vericut's ![]() (Step / Subroutine Options) or
(Step / Subroutine Options) or ![]() (Play / Start-Stop options) icon to start the simulation.
(Play / Start-Stop options) icon to start the simulation.
Take note of any messages that appear when the probe program is ran in Vericut’s Logger window and address accordingly.