AUTO-DIFF (AUTO-DIFF window)
Location:
Analysis tab >  (AUTO-DIFF)
Toolbar short cut: ![]()
The AUTO-DIFF command button opens the AUTO-DIFF panel enabling you to compare design model data against the Vericut simulated cut model. Using AUTO-DIFF, a licensed option, clearly identifies discrepancies between the cut model the intended design model. Errors are identified before actual machine time is wasted machining an incorrect part. You can use AUTO-DIFF interactively, in batch mode, or automatically via "Vericut-COMMAND" records in the tool path file. After using AUTO-DIFF to identify gouges and excess material, use other Vericut functions such as X-Caliper and Zoom (ref. View tab > Orient) to measure and help determine the source of the errors.

AUTO-DIFF is one of the dockable panels enabling you to dock it inside the Vericut main window if you choose. See Personalizing the Vericut Main Window section of Vericut Help for additional information.
📝 NOTE: When the AUTO-DIFF panel is docked, make sure that you click in the panel so that it becomes the "active" panel before using F1 to get help specific to the panel. Otherwise F1 will go to the Vericut Help Library.
Settings tab — Features on this tab control the AUTO-DIFF comparison, and what you see as a result.
Options tab — Features on this tab are used to set processing and reporting options.
Compare By Region tab — Features on this tab enable you to select a region to perform AUTO-DIFF on.
Compare Status Light — The compare status light enables you to determine at a glance the status of your AUTO-DIFF Compare. The color of the light, and label displayed, will change depending on the status as described below.
 Result Indicator — displays when the AUTO-DIFF "compare" has not finished running, or that the "compare" has been "restored".
 No Differences — displays when the AUTO-DIFF "compare" has finished running and no gouges/excesses were detected.
 Error Detected, Check Logger — displays when the AUTO-DIFF "compare" has finished running and gouges/excesses were detected.
Apply — Applies the current AUTO-DIFF window settings.
Compare — Compares the design model(s) specified by the AUTO-DIFF window settings. AUTO-DIFF automatically builds the report after the comparison has been done.
💡 Tip: If you are only interested in the graphical AUTO-DIFF results, toggle "on" the Disable Report feature, on the Options tab, to prevent AUTO-DIFF from automatically building the report.
Restore — Restores the Vericut model as it was before performing the AUTO-DIFF operation.
Close — Closes the AUTO-DIFF window without applying window changes.
Vericut Logger, AUTO-DIFF Report tab
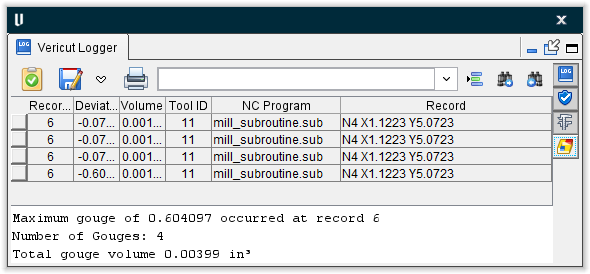
Accessed by selecting Compare in the AUTO-DIFF window, the AUTO-DIFF Report tab of the Vericut Logger provides information related to errors detected by AUTO-DIFF.
Selecting an error causes the view window to center the error in the display. If zoomed in, selecting an error will cause the window to fit the error to the window size. Using the up and down arrows on th keyboard also allows you to move to the previous and next errors respectively.
Vericut Logger toolbar

 (Save As) —
-
Text File — Save the AUTO-DIFF report as a text file.
-
CSV File — Save the AUTO-DIFF report in CSV (Comma Separated Value) file format that can be opened as a spreadsheet. When saving the report in CSV format, only the lower "table" portion of the report is saved. The information in the top of the AUTO-DIFF Report window is not saved.
![]() (Print) — Opens a window enabling you so print the AUTO-DIFF report.
(Print) — Opens a window enabling you so print the AUTO-DIFF report.
Line Number or Search Text — Use this text field to enter a line number or a string of text to search for.
![]() (Go To Line Number) — Searches the AUTO-DIFF Report table for the specified Record number. Enter the desired Record number in the text field.
(Go To Line Number) — Searches the AUTO-DIFF Report table for the specified Record number. Enter the desired Record number in the text field.
 (Search Forward) — Searches forward through the AUTO-DIFF Report table for the specified text string. Enter the desired text string in the text field.
 (Search Backward) — Searches backward through the AUTO-DIFF Report table for the specified text string. Enter the desired text string in the text field.
Each record in the AUTO-DIFF Report table provides the following information:
-
The record number in the NC program listing responsible for the error
-
The amount of the deviation from the design model.
- The ID of the tool being used at the time of the error.
- The name if the NC program being used.
- The NC record that was being processed at the time the error occurred.
Selecting an error record in the table highlights the location of the error on the model displayed in the Vericut graphics area. Select any column heading in the table to sort the report by the entries in that column.
AUTO-DIFF window, Settings tab
Location:
Analysis tab >  (AUTO-DIFF)
Toolbar short cut: ![]()
Features on this tab control the AUTO-DIFF comparison, and what you see as a result. You can compare four types of design data with AUTO-DIFF: solid models, surface data, inspection points and profiles. The Comparison Method controls which type of design data is compared, while Comparison Type determines the error condition checked for. Comparison Tolerance features set the inspection tolerances and the display colors used for identified gouge/excess errors. The appearance of the Comparison Tolerance portion of the Settings tab will vary depending on the Comparison Method Setting.
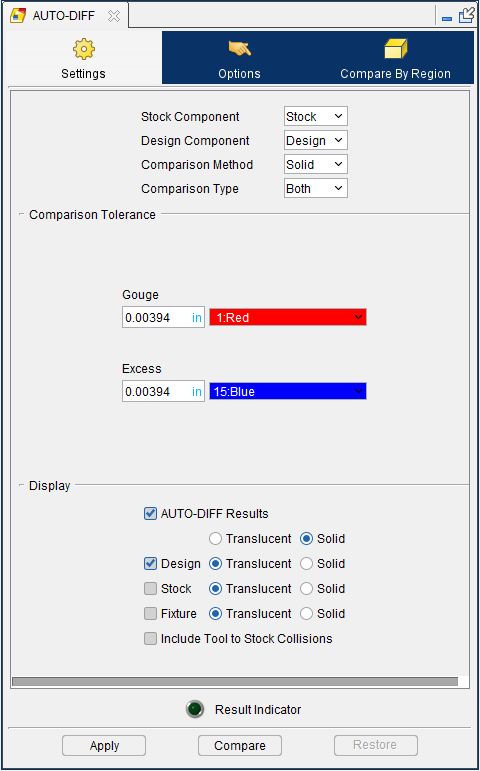
Stock Component — This option is used to specify which Stock component is to be used for the comparison. Select the desired Stock component from the pull-down list.
Design Component — This option is used to specify which Design component is to be used in the comparison regardless of its Visibility status. Select the desired Design component from the pull-down list.
Comparison Method — Controls the method of comparing design model data against the Vericut model. The comparison method also re-configures the Settings tab to reflect the tolerances and other data required to compare the data as requested. All methods generate an AUTO-DIFF model that can be analyzed or saved as an In Process file. Regardless of the method chosen, the design model must first be loaded prior to comparison (ref. Modeling window: Model tab). Design models can be loaded at any time. Options:
-
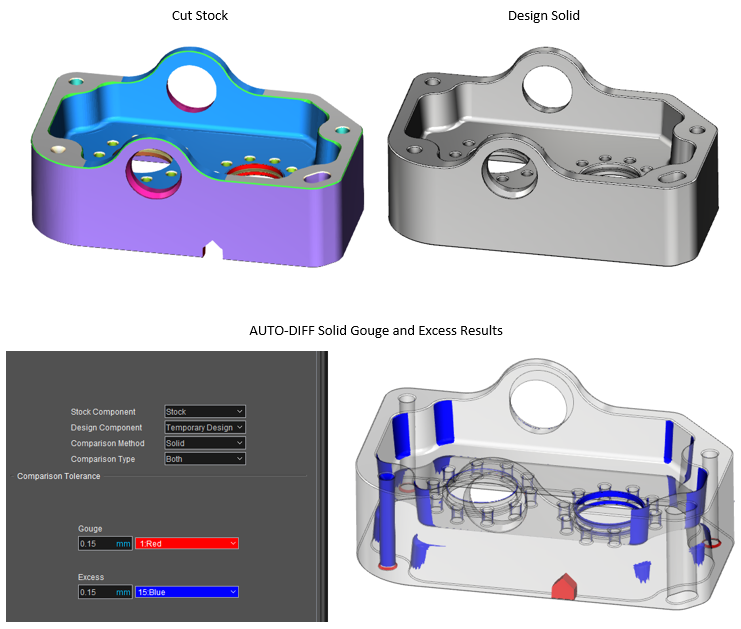
Solid — Compare a solid design model by subtracting solid models from each other. Solid models must be "watertight"-in other words, completely enclosed surfaces. See example below.
-
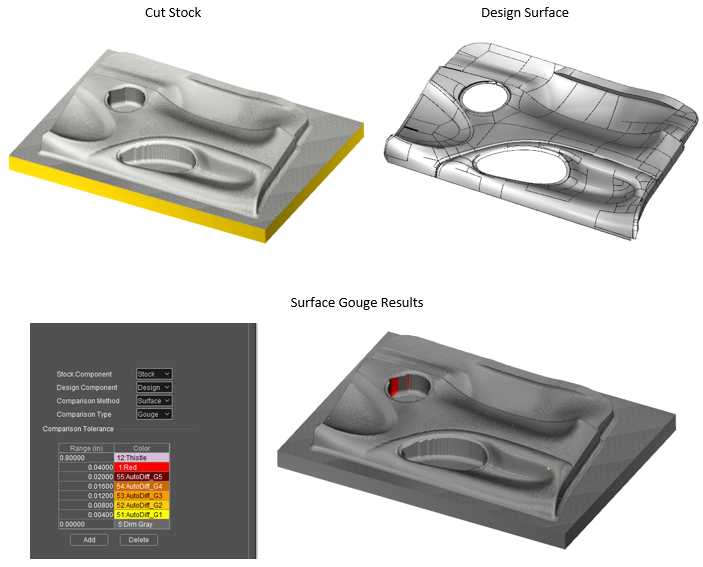
Surface — Compare a surface, set of surfaces, or skin of a solid design model or Vericut Solid by overlaying the surface on the cut model. Surface comparison provides multiple colors and tolerances that produce a "rainbow" affect to show the extent of errors. See example below.
📝 NOTE: Vericut Solids can only be used for Standard cutting mode. -
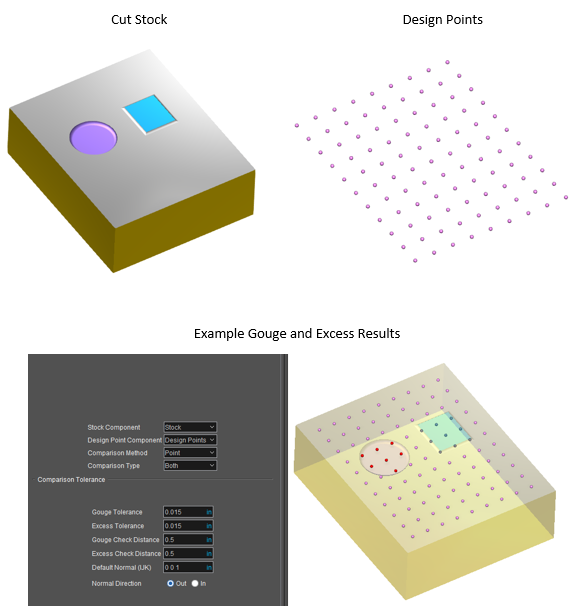
Point — Compare a set of design inspection points by overlaying the points on the cut model. Vericut searches from each point for an intersection with the model surface. Surface normal vectors control the direction in which to search. Only points associated with errors are seen in the results. Points associated with gouges have the Error color-typically Red, while points associated with excess material have the 5th defined color in the Shade Color list (typically Magenta). See example below.
-
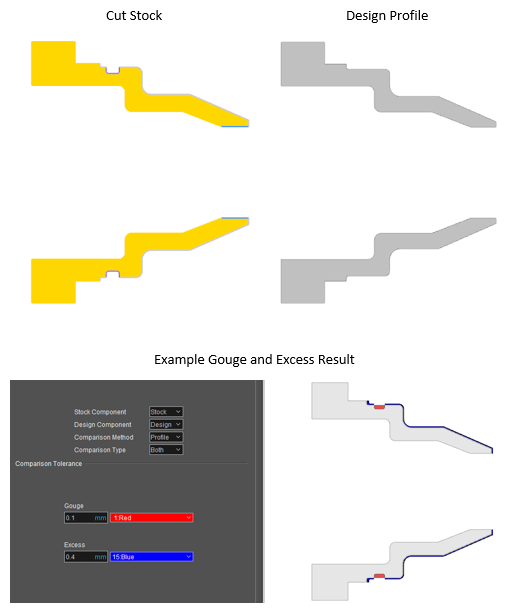
Profile — Enables you to compare the turning profile of the cut stock with profile of a design model. See example below.
AUTO-DIFF "Solid" method example
You can check solid design model integrity by loading it as a stock model, then select
X-Caliper tab > Volume to analyze the volume of the stock model. After checking the volume, the following problems indicate the design model needs repair, or is suitable only for the Surface comparison method:
-
small holes or gaps appear in the model
-
model falls apart-is partially displayed
- model disappears completely
AUTO-DIFF "Surface" method example
AUTO-DIFF "Point" method example
AUTO-DIFF "Profile" method example
When Comparison Method is set to Profile, up to four profiles (Gouge, Excess, Stock, and Design) may be displayed in the "Profile" view. Each can be displayed in one of two modes: Solid or Lines. The display mode for Stock and Design profiles is specified using the Design Display / Stock Display features. The display mode for Gouge and Excess is specified using the Draw Mode option in the View Attributes window for the currently active "Profile" view.
When display mode is set to "Solid", Stock and Design profiles are displayed the "component" color unless the "model" color is different than the "component" color. In this case, Stock and Design profiles are displayed the color of the 1st model. Gouge and Excess profiles are displayed in the color selected with the Comparison Tolerance "color" feature.
When display mode is set to "Lines", the same color scheme described above is used for "uncut" sections of the profile. "Cut" sections of the profile are displayed in the "cut" color.
X-Caliper can be used to analyze any of the profiles (Gouge, Excess, Design, and Stock profiles) currently displayed in a "Profile" view. Saving an In-Process file (IP file) stores all four profile types.
Any valid Vericut model type can be used as a design model for an AUTO-DIFF Profile comparison. The design profile which is compared to stock profile is a Boolean union of the individual profiles of all Design Component models associated with specified Stock.
If a design model is a Cone, Cylinder, SOR, or IGES Profile, and its Z-axis is aligned with the turning axis, its profile is built directly from its definition profile and is "exact". In all other cases, the profile is built by spinning the model about the turning axis (as is common with other turning applications) and is an approximation. The smaller the Cut Tolerance that is used, the better the approximation. If the "design component" consists of multiple models, the individual model profiles are merged into one design profile.
Comparison Type — Controls the error type(s) checked for by the AUTO-DIFF operation. Options:
-
Gouge
-
Excess
-
Both
Comparison Tolerance Features
Comparison Tolerance features are used to specify the tolerances and colors used by AUTO-DIFF. The degree to which Vericut can detect discrepancies is also affected by Cutting Resolution. For best results set Cutting Resolution smaller than the smallest tolerances used by AUTO-DIFF.
Comparison Tolerance features displayed will vary depending the on the Comparison Method and Comparison Type settings.
Solid comparison tolerances
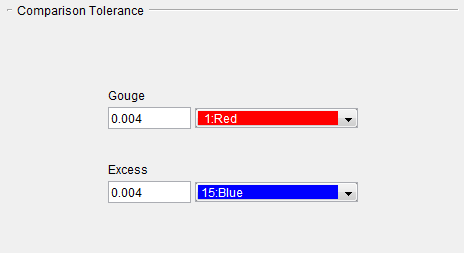
Gouge — Tolerance used when checking for gouges during a Solid comparison. Gouges detected by AUTO-DIFF are shaded in the associated gouge color.
Excess — Similar to Gouge above, except applies when checking for excess material.
📝 NOTE: "Solid" Gouge/Excess tolerance/color values are independent of "Profile" Gouge/Excess tolerance/color values and are stored as separate values in .VcProject file.
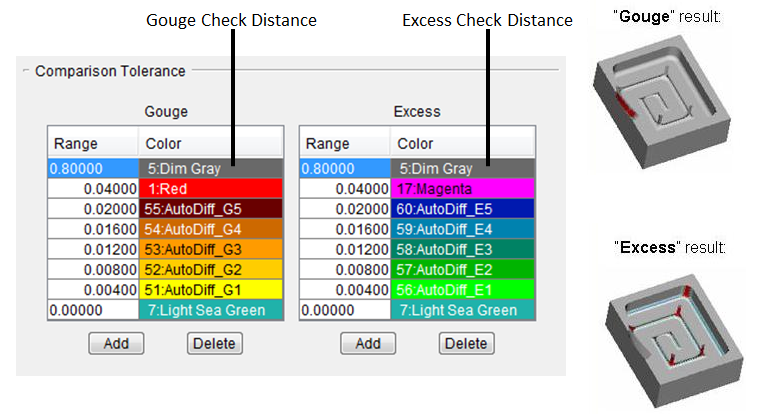
Surface comparison tolerances
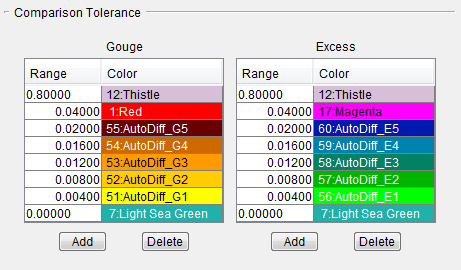
Gouge Range/Color list — Range of tolerances used when checking for gouges during a Surface comparison. Multiple tolerance values can be specified, in addition to the "Gouge Check Distance" (in this case, 0.75000) used to limit checking, and the Range value of 0.00000 which represents surfaces cut exact with no deviation from the design model. If more than six tolerance values are specified, a scroll bar will be added to the table. Use the Add and Delete buttons to add/remove tolerance values. The table row containing the Range value of 0.00000 cannot be deleted, and the 0.00000 value cannot be modified.
Gouges detected by AUTO-DIFF are shaded in the gouge color(s) associated with the depth of the gouge. Each pair of tolerance values represents a range of gouge depths to which a gouge color is associated. The gouge color used for each range is the color assigned to the lower tolerance value in the range. For example, in the gouge table shown above, all gouges with depths in the range between 0.04500 and 0.06000, will be displayed Light Steel Blue.
The color associated with the "Gouge Check Distance" can be different for the Gouge and Excess tables, but the color associated with the Range value of 0.00000 is forced to be the same for both tables.
Excess Range/Color list — Similar to Gouge Range/Color list above, except applies when checking for excess material.
Sample “Surface” comparison Tolerance /Colors
Minimum Excess — This feature enables you to specify a value and color to be used to represent an offset from the design surface. The Minimum Excess value is applied to the design surface in all directions. During the compare, any Excess value less than the Minimum Excess value is considered to be a gouge and displayed the Minimum Excess color. Excess material is measured from the Minimum Excess to the Range value (see the picture below).
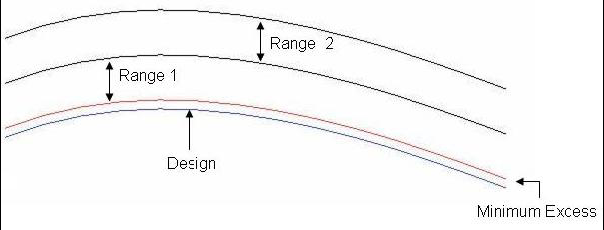
📝 NOTE: The amount of gouge and excess reported is with respect to the offset design, not the original design. In other words, zero deviation is where the cut stock excess with respect to the original design exactly equals to the given "Minimum Excess" value. This also is where the Excess color table range starts from.
While in this mode, AUTO_DIFF > Report shows both gouges and excesses with respect to the condition described above. If a cut produces both a gouge and an excess, AUTO-DIFF reports the gouge (no matter what the value of the excess). This is different from the Report behavior when "Comparison Type" = "Both" where the biggest deviation would be reported.
Point comparison tolerances
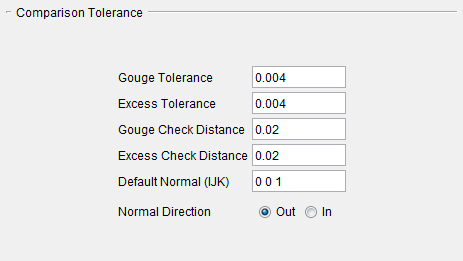
Gouge Tolerance — Tolerance used when checking for gouges during a Point comparison. Gouges detected by AUTO-DIFF are shaded in the gouge color specified for a Solid comparison.
Excess Tolerance — Similar to Gouge above, except applies when checking for excess material conditions.
Gouge Check Distance — Maximum distance to check for the cut model surface in the gouge direction. Distance is measured from the inspection point along direction of the normal vector used with the inspection point.
Excess Check Distance — Similar to Gouge Check Distance above, except applies when checking for excess material.
Default Normal (IJK) — Default normal vector in which to check during a Point comparison when vector data is not present in the Design Points file (ref. Design Points File in the Getting Started section of Vericut Help). Enter three values separated by spaces, for example "0 0 1".
Normal Direction — Indicates if surface normal vectors associated with design points are pointing outward (Out) or inward (In) relative to the design model.
Profile comparison tolerances
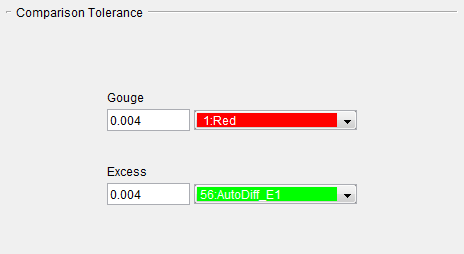
The Profile comparison tolerances are applied "exactly", without tessellating the stock and/or design profiles. An arc offset by the tolerance value, will also be an arc and will be recognized by X-Caliper as such. The Profile Gouge/Excess tolerance values are independent of the Solid Gouge/Excess tolerance values described above, and are stored as separate values in .VcProject file.
Gouge — Tolerance used when checking for gouges during a Profile comparison. Gouges detected by AUTO-DIFF are shaded in the associated gouge color.
Excess — Similar to Gouge above, except applies when checking for excess material.
📝 NOTE: "Profile" Gouge/Excess tolerance/color values are independent of "Solid" Gouge/Excess tolerance/color values and are stored as separate values in .VcProject file.
Display
The features in this group only become active after Compare has been clicked.
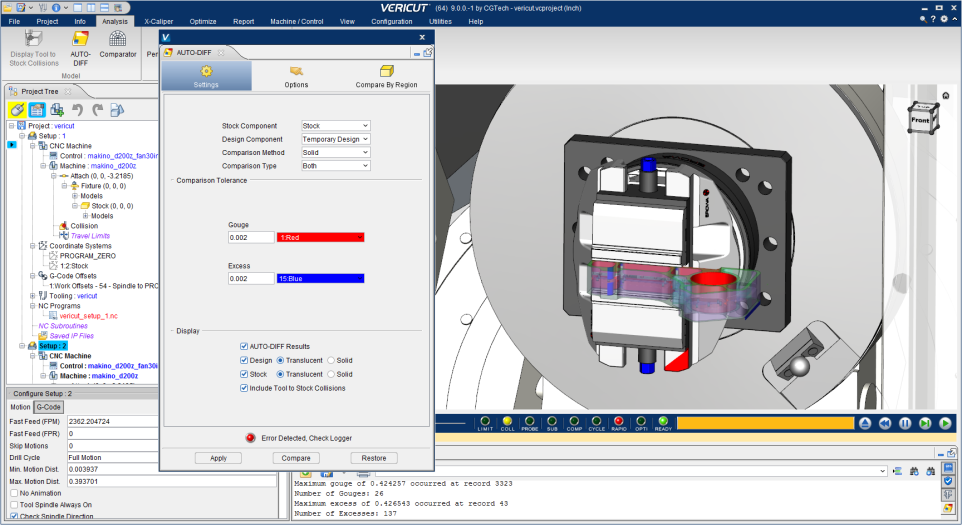
AUTO-DIFF Results — Toggle this feature on (checked) to display AUTO-DIFF results visually in order to better see disparities between design and actual cuts.
Design — Toggle this feature on (checked) to display the design. Select between displaying it as Translucent or as Solid.
Stock — Toggle this feature on (checked) to display the stock. Select between displaying it as Translucent or as Solid.
Fixture — Toggle this feature on (checked) to display fixtures. Select between displaying it as Translucent or as Solid.
Include Tool to Stock Collisions — Toggle this feature on to display tool/stock collisions.
AUTO-DIFF window, Options tab
Location:
Analysis tab >  (AUTO-DIFF)
Toolbar short cut: ![]()
The features on this tab are used to set processing and reporting options.
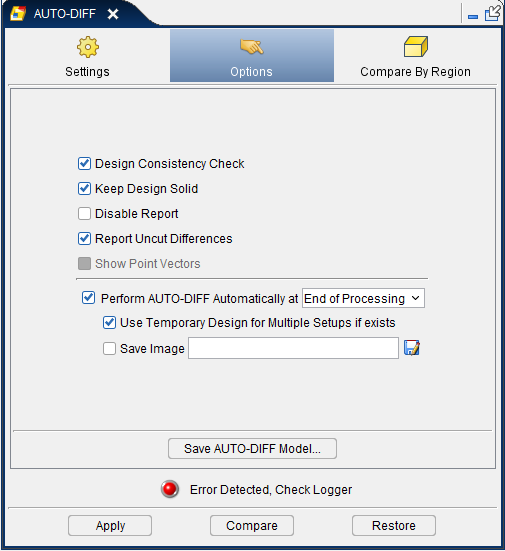
Design Consistency Check — When selected during a "Solid" comparison, checks consistency of solid design models, including: check for "watertight" solid- repair improperly trimmed surfaces (overlaps and gaps), and reconstruct insignificant missing surfaces. This option is highly recommended for design models creating from importing IGES data, and other model files which produce unsatisfactory results from the comparison.
When selected during a "Profile" comparison, Design Consistency Check is applicable when building a profile from an STL, Vericut Polygon, or Vericut Solid design model.
While checking design model consistency can take a while, it provides the best insurance for reliable AUTO-DIFF results. If you've used the model in Vericut before and know the quality is good enough, you can save time by clearing this checkbox. AUTO-DIFF will take less time, but results may not be reliable if the solid is not water-tight.
Keep Design Solid — When selected, keeps the solid design model created by AUTO-DIFF so it can be used in additional comparisons. This action can reduce AUTO-DIFF time if multiple comparisons are made, but will require additional computer resources to keep the design solid. The design solid is kept until the Vericut model is reset, a design model is removed or deleted, or the checkbox is cleared and Apply is pressed. Saving an IP file also contains the kept design solid. Clear this checkbox to have AUTO-DIFF create a new design solid for each comparison.
Disable Report — Enables you to turn off the AUTO-DIFF Report feature to reduce AUTO-DIFF processing time. To generate the report, the processor must search through all cut records and lists the maximum error for each bad cut record. This can take a significant amount of time for large NC program files. When is toggled "on", you will still see the AUTO-DIFF results in the graphic area. Disable Report is only active when Comparison Method is set to Solid, Surface, or Profile.
Report Uncut Differences — When selected, differences between the design and uncut stock are added to the AUTO-DIFF report. Feature is autoselected by default.
Perform AUTO-DIFF Automatically at — Toggle on (checked) to run AUTO-DIFF in the background at either "End of each Setup" or "Process End."
Use Temporary Design for Multiple Setups if exists — Toggle on (checked) to create a Temporary Design component that will be used instead of the Design Component that was specified in the Settings tab.
Save Image — Toggle on (checked) to save a screenshot after AUTO-DIFF is performed. For "End of each Setup," the actual image name will be [defined image name}_[setup name].ext. Otherwise, [defined image name] is used.
Save AUTO-DIFF Model — Use to save gouge or excess data as a Vericut solid model file (.vct). Selecting Save AUTO-DIFF Model displays a dialog enabling you to specify a folder path and filename for the model file. If both gouge and excess models are present, two files will be created ( gouge_filename.vct and excess_filename.vct, where filename is the filename you entered in the Save AUTO-DIFF Model dialog.
This option is only available for use if all of the following are true (otherwise it is grayed out):
-
Standard Cut Mode is active.
-
Constant Gouge Check is turned off.
- AUTO_DIFF Comparison Method is set to Solid or Profile.
- AUTO-DIFF Compare has been processed.
AUTO-DIFF window, Compare By Region tab
Location:
Analysis tab >  (AUTO-DIFF)
Toolbar short cut: ![]()
The features on this tab enable you to select a region to perform AUTO-DIFF on. Compare By Region is created for very large parts that would require too much memory for AUTO-DIFF to process the entire part. Optionally, cut stock can be internally re-cut within the region with a better Cut Tolerance before doing AUTO-DIFF. The Compare By Region tab is not available when Comparison Method is set to "Profile".
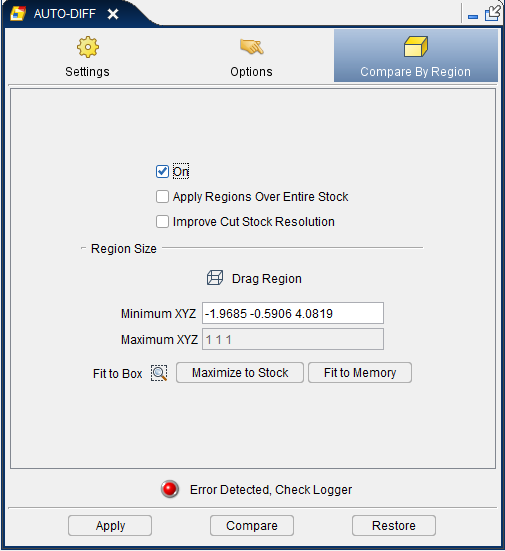
On — When selected, activates the Compare by Region feature. When toggled "on", AUTO-DIFF comparison only processes the cut stock and design volumes within the specified "region".
Apply Regions Over Entire Stock — The check box, Apply Regions Over Entire Stock, does the following:
- Calculates a region that can achieve the specified Comparison Tolerance within the computer’s physical memory.
-
Re-processes that region of the cut stock at a tolerance that ensures the Comparison Tolerance can be achieved.
-
Does the specified AUTO-DIFF comparison for the region.
- Repositions the region and does AUTO-DIFF multiple times over the entire cut stock.
During AUTO-DIFF processing, the Region Box is displayed at each position over the cut stock.
When Compare is pressed and this box is checked, a notice dialogue is displayed with the text, “Processing may take several minutes depending on tolerance, size of the cut stock, memory and processor speed. Press the stop button in the main window to cancel AUTO-DIFF.”, OK.
When the Apply Regions Over Entire Stock feature is active, the Region Size features are disabled.
Improve Cut Stock Tolerance — When selected, the Cut Stock is re-evaluated at a new tolerance based on the specified minimum AUTO-DIFF tolerance. Having this box checked affects the results from both the Fit to Memory and the Apply Regions Over Entire Stock features. Typically the Comparison Tolerance is smaller than the Cut Tolerance, so processing will take longer when Improve Cut Stock Tolerance is active.
Region Size features
 Drag Region — When toggled “on” (highlighted yellow), enables you to resize or move the “region box”. When active the cursor displays as a box.
Grab a corner of the "region box" with the cursor and drag it to re-size the "region box". The new corner location is automatically projected onto the cut stock in 3 dimensional space.
Grab the mid-point of one of the "region box" edges to re-size the "region box" by dragging a face.
Click with the mouse pointer in the point representing the center of the "region box" and drag around the Cut Stock to reposition the "region box" without resizing it.
Minimum XYZ — Use to enter the minimum X, Y, and Z values (relative to the workpiece coordinate system), separated by spaces. These values represent the X, Y, Z coordinates of first corner point of the "region box".
Maximum XYZ — Use to enter the maximum X, Y, and Z values (relative to the workpiece coordinate system), separated by spaces. These values represent the X, Y, Z coordinates of the diagonal corner point of the "region box".
Maximize to Stock — Use to size the "region box" to the maximum extent of the union of the stock and design volumes.
Fit to Box — Use to drag a 2 dimensional rectangle (similar to a "zoom" box) over the cut stock. The rectangle is projected into 3 dimensional space to define the "region box".
Fit to Memory — Use to automatically size the "region box" based on the available memory for AUTO-DIFF. A short delay occurs while memory is analyzed.