Status (Status panel)
Location: Home tab >  (Status)
The Status command button opens the Status panel that provides status information about the simulation, and what would be occurring on the NC machine. The information displayed in the Status window will differ depending on whether the review file that you are viewing was created in Vericut, VCS, or VDAF. Click the following links to be navigated to the section relevant to the software where your review file was created:
Veircut Simulation Review Files
Vericut Composite Simulation Review Files
Vericut Drill and Fastener Simulation Review Files
The Status panel is also one of the dockable panels enabling you to dock it inside the Vericut Reviewer main window if you choose. See Dockable Panels in the Getting Started section of Vericut Reviewer Help for additional information.
📝 NOTE: When the Status window is docked, make sure that you click in the window so that it becomes the "active" window before using F1 to get help specific to the window. Otherwise F1 will go to the first page of Vericut Reviewer Help.
Vericut Simulation Review files
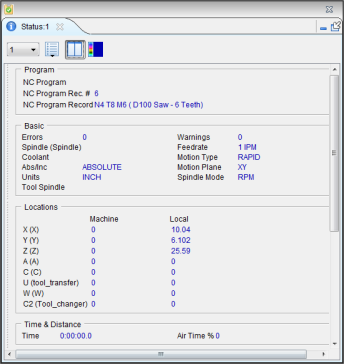
The following Status panel features are available in a Vericut Simulation review file:
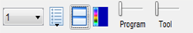
Icon Bar
![]()
The items in the Icon Bar enable you to specify the SubSystem that you want the information in the Status panel to apply to, specify which groups that you want displayed in the Status panel, specify whether you want the Status panel displayed vertically or horizontally, and specify the color that you want the data displayed in.. Holding the cursor over the icon will display a short description of what the icon is used for.
 (SubSystem) — When a machine with more than one subsystem is in use, use this feature to specify which subsystem that you want the information in the Status panel to apply to. Select the Subsystem from the pull-down list.
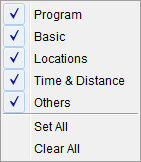
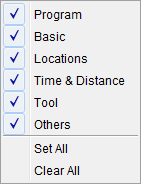
 (Set Group Visibility) — Click on this icon to display the menu shown below which enables you to specify which information groups you want displayed in the Status panel.
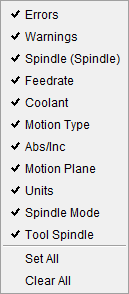
Click in the box next to each information group’s name to toggle between display (checked) and do not display (unchecked). Use the Set All feature to set all information groups to display (checked). Use the Clear All feature to set all information groups to do not display (unchecked). You can select any combination of groups to be displayed in the Status panel. You can change the order of the information groups by clicking in an information group displayed in the Status panel and dragging it to the desired location.
![]() /
/ (Tile Groups Horizontally/Vertically) — This icon toggles between Horizontally and Vertically enabling you to specify whether you want to display the Status panel in a vertical orientation or in a horizontal orientation.
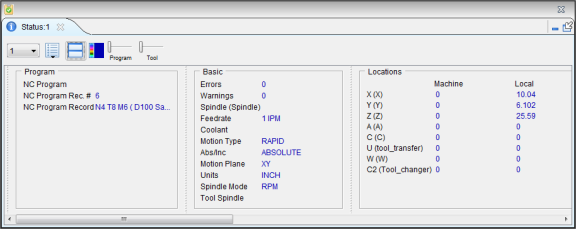
Click on the ![]() (Horizontally) icon to display the Status panel in a horizontal orientation as shown in the picture below.
(Horizontally) icon to display the Status panel in a horizontal orientation as shown in the picture below.
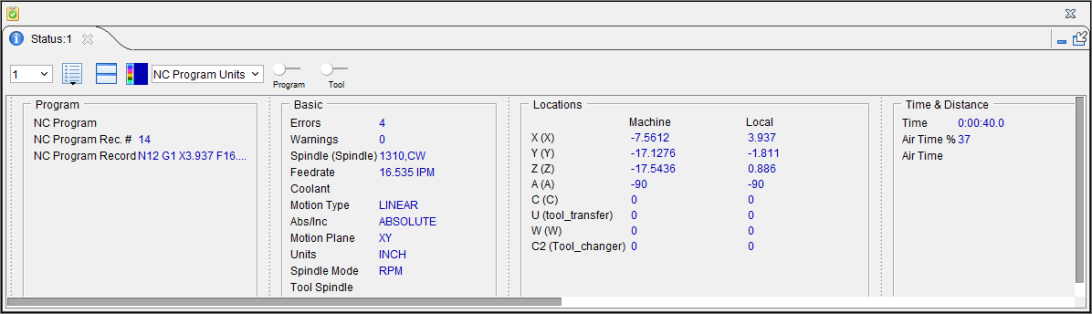
Notice that 2 sliders is are added to the Icon Bar as shown in the picture below.
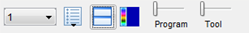
The first slider enables you to adjust the width of the Program column so that you can see the complete records.
The second slider enables you to adjust the width of the Tool column so that you can see the complete records.
Both sliders are only available when the Status window is in a Horizontal orientation.
Click on the (Vertically) icon to display the Status panel in a vertical orientation.
 (Set Value Text Color) — Use this icon display a color palette enabling you to specify the color that you want the information in the Status panel to be displayed in.
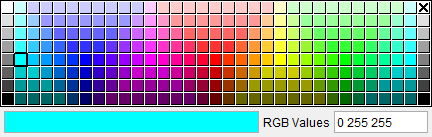
The right side of the (Set Value Text Color) icon shows the current color being used for the information in the Status panel. To change the color for the information, click on the (Set Value Text Color) icon to display the color palette window shown below.

Click on a color in the color palette window, to specify the color for the information in the Status panel. The color palette will close and the right side of the  (Set Value Text Color) icon in the Status panel icon bar will update to reflect the selected color.
Close the color palette window without changing the color by clicking on the ![]() in the upper right corner of the color palette.
in the upper right corner of the color palette.
Right Mouse Menus
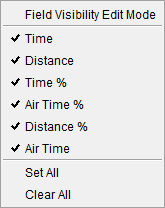
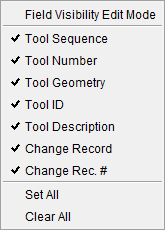
Right-clicking in any group will produce a menu of features you can toggle on or off. Each menu will be shown in its relevant section but the basic function of the menu is the same across each section.
A  next to a feature indicates that the feature is to be displayed in the group.
The absence of a next to a feature indicates that the feature is not to be displayed in the group.
Use Set All to select all features for display in the group.
Use Clear All to remove the from all features in the group.
Information Groups
Program Group
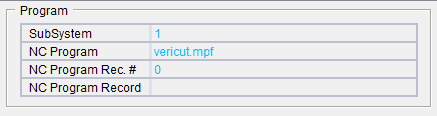
The following information is available for display in the Program Group:
SubSystem — When a machine with more than one subsystem is in use, this option controls which subsystem status to show.
NC Program — The name of the current NC program file.
NC Program Rec. # — The line number of the current NC program record.
NC Program Record — Current NC Program record being processed. Both the record text and sequential line number in the file are shown.
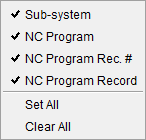
Right-click in a Program Group displayed in the Status panel to display the following window that enables you specify the features that you want displayed in the Program Group.
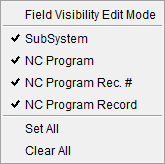
See Right Mouse Menus for more information on how to use this menu.
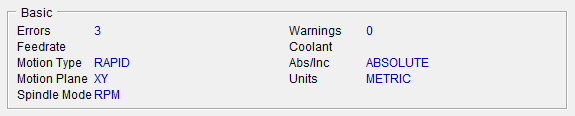
Basic Group
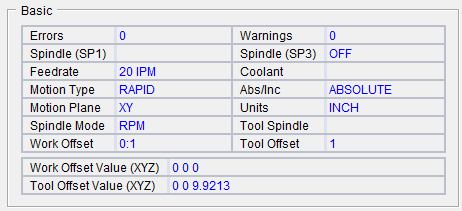
The following information is available for display in the Basic Group:
Errors — Displays the number of errors detected by Vericut during processing. A blank field indicates that no errors were detected. Consult the Log file for details about the errors.
Warnings — Similar to Errors above, except that the number of warnings detected is displayed.
Spindle — Current programmed spindle speed. A blank field indicates no records that control spindle speed that have been processed.
Machines with multiple spindles will have multiple Spindle entries in the Status window.
The name used for a particular Spindle in the Project Tree will be shown in parentheses as shown in the examples below:
-
Spindle (Tool_Spindle)
-
Spindle (Spindle)
-
Spindle (Spindle2)
Feedrate — Current programmed feed rate. A blank field indicates no records that control feed rate that have been processed.
Coolant — Current programmed coolant condition. A blank field indicates no records that control coolant that have been processed.
Motion Type — Rapid / Linear / CW / CCW / Thread / Nurbs / Poly
Abs/Inc — Absolute / Incremental
Motion Plane — XY / YZ / ZX
Units — Inch / Metric
Spindle Mode — CSS / RPM
Tool Spindle — Displays which spindle is active.
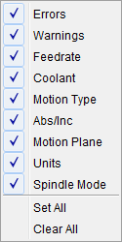
Right-click in a Basic Group displayed in the Status panel to display the following window that enables you specify the features that you want displayed in the Basic Group.
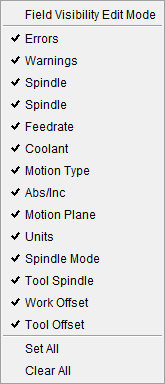
See Right Mouse Menus for more information on how to use this menu.
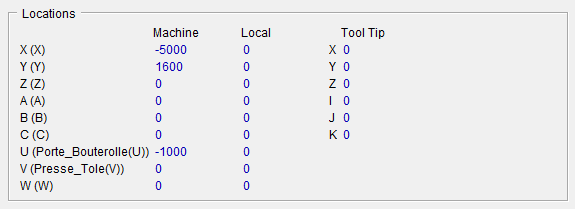
Locations Group
The following information is available for display in the Locations Group:
Machine — Current locations of machine axes (X, Y, Z, A, B, C, U, V, W, A2, B2, C2) resulting from processing the current G-Code NC program record. Only the axes that exist for the selected subsystem will be shown.
The name used for a particular Machine axis in the Project Tree will be shown in parentheses as shown in the examples below:
-
Machine X (X)
-
Machine A (toolorient)
-
Machine W (Sub-spindle)
-
Machine C2 (sub-caxis)
Local — The display will be similar to the Machine Axes (only showing the axes that exist for the selected subsystem). The contents of the "Local Axes" fields will represent the current axis (X, Y, Z, A, B, C, U, V, W, A2, B2, C2) locations in the local coordinate system. Typically, this will correspond to the values entered in the NC program file (except when specifying machine coordinates, or incremental values).
The name used for a particular Machine axis in the Project Tree will be shown in parentheses as shown in the examples below:
-
Local W (Sub-spindle)
-
Local C2 (sub-caxis)
Tool Tip — Current X Y Z tool tip location and I J K tool axis orientation with respect to the active NC program coordinate system.
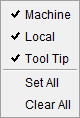
Right-click in a Locations Group displayed in the Status panel to display the following window that enables you specify the features that you want displayed in the Locations Group.
See Right Mouse Menus for more information on how to use this menu.
Time & Distance Group
The following information is available for display in the Time & Distance Group:
Time — Time anticipated to machine the part (as simulated by Vericut). To calculate anticipated machining time, Vericut records time for tool motions based on specified cutting feed rates and rapid rates.
Distance — The tool movement distance, in inches or millimeters, depending on the Vericut session configuration.
Time % — Percentage of time in feed rate mode. This value can be helpful when judging tool path efficiency. For example, a high value suggests an efficient tool path, since a value less than 100 percent means that the tool is moving at rapid feed and is probably not removing material.
Air Time % — The percent of time spent cutting air.
Distance % — Percentage of tool movement distance in feed rate mode. Similar to the Time versus Time % relationship described above, this value can also be helpful when judging tool path efficiency.
Air Time —The time spent cutting air. For each motion or dwell, if material was not cut, we add the time for the motion/dwell to the “Air Time”.
Right-click in a Time & Distance Group displayed in the Status panel to display the following window that enables you specify the features that you want displayed in the Time & Distance Group.
See Right Mouse Menus for more information on how to use this menu.
Tool Group
The following information is available for display in the Tool Group:
Sequence — Sequential number of the last tool change event.
Number — Tool number in use (if specified). Examples follow.
| NC program type: | Sample tool chg record: | Status window "Number": |
|---|---|---|
| G-Code data | T10M6 | 10 |
| APT | CUTTER/... | none |
| APT | PPRINT/Vericut-TC... | none |
| APT | LOADTL/1 | 1 |
| UG CLS | LOAD/TOOL,4,... | 4 |
Geometry — Cutter shape geometry. The method used to define the cutter shape is shown in square brackets "[ ]" followed by the description. "PROFILE" indicates a profile type of cutter definition.
ID — ID of a tool retrieved from a Vericut Tool Library file, if any. A blank field indicates the current tool did not come from a tool library or that the specified tool did not exist in the Tool Library.
If the ID differs from the Number field value described above, the specified tool shown in the Number field could not be found in the Tool Library.
Description — Description of a tool retrieved from a Vericut Tool Library file. A blank field indicates a description for this tool was not defined in the library, or the tool did not come from a tool library.
Change Record — The last tool change record processed. Both the record text and sequential line number in the file are shown.
Change Rec. # — The line number of the last tool change record.
Right-click in a Tool Group displayed in the Status panel to display the following window that enables you specify the features that you want displayed in the Tool Group.
See Right Mouse Menus for more information on how to use this menu.
Optimization Group
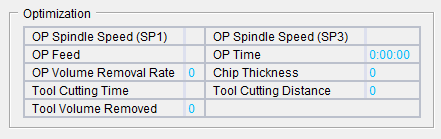
The following information is available for display in the Optimization Group:
Spindle Speed — Optimized spindle speed, as calculated by Optimization.
Machines with multiple spindles will have multiple Optimized Spindle Speed entries in the Status window.
The name used for a particular Spindle in the Project Tree will be shown in parentheses as shown in the examples below:
-
Optimization Spindle Speed (Tool_Spindle)
-
Optimization Spindle Speed (Spindle)
-
Optimization Spindle Speed (Spindle2)
Feed — Optimized feed rate, as calculated by Optimization
Time — Time anticipated to machine the part with an optimized tool path file. This field is only updated when the current tool path if being optimized by Optimization. To estimate machining time saved by Optimization, compare this value against the Time field value.
📝 NOTE: OP Time DOES NOT consider feedrates output as a result of Acceleration/Deceleration optimization adjustments.
The following features are in effect when Optimization Mode is set to On, Prompt While Cutting, or Learn From NC Program. They report maximum volume removal rate and chip thickness for each cut calculated by Optimization for the programmed feedrate.
Volume Removal Rate — Volume Removal Rate is calculated for any Optimization Method and for any tool valid for Optimization. See the Cutting Conditions Note below.
Chip Thickness — Chip Thickness is calculated only if the Optimization Method for the current tool is either Chip Thickness, or Chip Thickness and Volume Removal Rate. Chip Thickness is not calculated when Optimization optimizes by any other method. When Optimization Mode is set to Learn From NC Program, Chip Thickness is calculated only for tools, which have a convex profile. See the Cutting Conditions Note below.
📝 OPTIMIZATION NOTE: The Record Cutting Conditions feature (ref. Properties window in the Project Tree section of Vericut Help) in the File tab > Properties window must be toggled "on" (checked) for the values of the following features to be displayed in the Status panel when Optimization is not active. This feature is only valid for jobs that could normally be optimized using Optimization.
-
Optimize Volume Removal
-
Optimize Chip Thickness
Tool Cutting Time — Displays the amount of time that the current tool has been removing material. See the Tool Notes below.
Tool Cutting Distance — Displays the distance that the current tool has moved while removing material. See the Tool Notes below.
Tool Volume Removed — Displays the volume of material that the current tool has removed. See the Tool Notes below.
📝 TOOL NOTES:
The Check Cutting Limits feature on the Project Tree Configure Setup menu, Motion tab (see Vericut Help for more information) must be toggled on (checked) for the values of the following features to be displayed in the Status window.
-
Tool Cutting Time
-
Tool Cutting Distance
-
Tool Volume Removal
Each Load Tool in the NC program resets these values (even if the same tool from Tool Manager is loaded again and again).
Right-click in an Optimization Group displayed in the Status panel to display the following window that enables you specify the features that you want displayed in the Optimization Group.
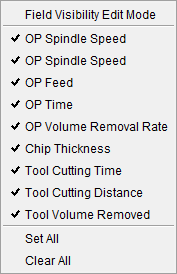
See Right Mouse Menus for more information on how to use this menu.
Cutting Conditions Group
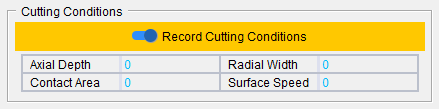
The following information is available for display in the Cutting Conditions Group:
Record Cutting Conditions — Toggle this feature on (toggle to the right) for the values of the following features to be displayed in the Status panel when Optimization is not active. This feature is only valid for jobs that could normally be optimized using Optimization.
📝 CUTTING CONDITIONS NOTE: The Record Cutting Conditions feature must be toggled on for the values of the following features to be displayed in the Status panel when Optimization is not active. This feature is only valid for jobs that could normally be optimized using Optimization.
Axial Depth — Displays the current depth of the cut. See the Cutting Conditions Note above.
Radial Width — Displays the current width of the cut. See the Cutting Conditions Note above.
Contact Area — Displays the area of the tool that is in contact with the material. See the Cutting Conditions Note above.
Surface Speed — Displays the current surface speed. See the Cutting Conditions Note above.
Right-click in a Cutting Conditions Group displayed in the Status panel to display the following window that enables you specify the features that you want displayed in the Cutting Conditions Group.
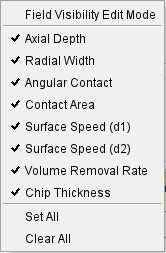
See Right Mouse Menus for more information on how to use this menu.
Others Group
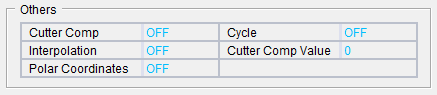
The following information is available for display in the Others Group:
Cutter Comp — This feature displays the current cutter compensation status. ON / ON-COMP /OFF
Cycle — Off / Drill / Face / Deep / Tap /Bore / Mill / Thru / Bore Orient / Bore Drag
Interpolation — None / Polar / Cylindrical
Cutter Comp Value — The current cutter compensation value.
Polar Coordinates — Display the status of polar coordinate input (ON/OFF).
Right-click in an Others Group displayed in the Status panel to display the following window that enables you specify the features that you want displayed in the Others Group.
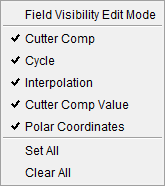
See Right Mouse Menus for more information on how to use this menu.
💡 Tip: You can send status information to a text file. To accomplish this, set the CGTECH_STATUS environment variable to the name of the file before or when Vericut is executed.
Vericut Composite Simulation Review Files
The following Status panel features are available in a Vericut Composite Simulation:
Icon Bar
![]()
The items in the Icon Bar enable you to specify the SubSystem that you want the information in the Status panel to apply to, specify which groups that you want displayed in the Status panel, specify whether you want the Status panel displayed vertically or horizontally, and specify the color that you want the data displayed in.. Holding the cursor over the icon will display a short description of what the icon is used for.
 (SubSystem) — When a machine with more than one subsystem is in use, use this feature to specify which subsystem that you want the information in the Status panel to apply to. Select the Subsystem from the pull-down list.
 (Set Group Visibility) — Click on this icon to display the menu shown below which enables you to specify which information groups you want displayed in the Status panel.
Click in the box next to each information group’s name to toggle between display (checked) and do not display (unchecked). Use the Set All feature to set all information groups to display (checked). Use the Clear All feature to set all information groups to do not display (unchecked). You can select any combination of groups to be displayed in the Status panel. You can change the order of the information groups by clicking in an information group displayed in the Status panel and dragging it to the desired location.
![]() (Tile Groups Horizontally/Vertically) — This icon toggles between Horizontally and Vertically enabling you to specify whether you want to display the Status panel in a vertical orientation or in a horizontal orientation.
(Tile Groups Horizontally/Vertically) — This icon toggles between Horizontally and Vertically enabling you to specify whether you want to display the Status panel in a vertical orientation or in a horizontal orientation.
Click on the  (Horizontally) icon to display the Status panel in a horizontal orientation as shown in the picture below.

Notice that a slider has been added to the Icon Bar as shown in the picture below.
The slider enables you to adjust the width of the Program column so that you can see the complete records. The slider is only available when the Status window is in a Horizontal orientation.
Click on the ![]() (Vertically) icon to display the Status panel in a vertical orientation as shown in the picture below.
(Vertically) icon to display the Status panel in a vertical orientation as shown in the picture below.
 (Set Value Text Color) — Use this icon display a color palette enabling you to specify the color that you want the information in the Status panel to be displayed in.
The right side of the (Set Value Text Color) icon shows the current color being used for the information in the Status panel. To change the color for the information, click on the (Set Value Text Color) icon to display the color palette window shown below.

Click on a color in the color palette window, to specify the color for the information in the Status panel. The color palette will close and the right side of the  (Set Value Text Color) icon in the Status panel icon bar will update to reflect the selected color.
Close the color palette window, without changing the color by clicking on the ![]() in the upper right corner of the color palette.
in the upper right corner of the color palette.
Information Groups
Program Group
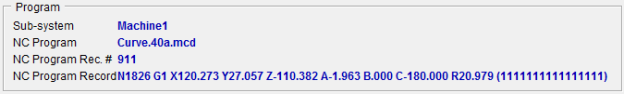
The following information is available for display in the Program Group:
SubSystem — When a machine with more than one subsystem is in use, this option controls which subsystem status to show.
NC Program — The name of the current NC program file.
NC Program Rec. # — The line number of the current NC program record.
NC Program Record — Current NC Program record being processed. Both the record text and sequential line number in the file are shown.
Right-click in a Program Group displayed in the Status panel to display the following window that enables you specify the features that you want displayed in the Program Group.

See Right Mouse Menus for more information on how to use this menu.
Basic Group
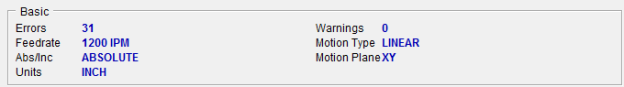
The following information is available for display in the Basic Group:
Errors — Displays the number of errors detected by Vericut Composite Simulation during processing. A blank field indicates that no errors were detected. Consult the Log file for details about the errors.
Warnings — Similar to Errors above, except that the number of warnings detected is displayed.
Feedrate — Current programmed feed rate. A blank field indicates no records that control feed rate that have been processed.
Motion Type — Rapid / Linear / CW / CCW / Thread / Nurbs / Poly
Abs/Inc — Absolute / Incremental
Motion Plane — XY / YZ / ZX
Units — Inch / Metric
Right-click in a Basic Group displayed in the Status panel to display the following window that enables you specify the features that you want displayed in the Basic Group.
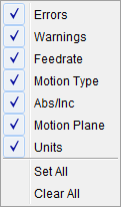
See Right Mouse Menus for more information on how to use this menu.
Locations Group
The following information is available for display in the Locations Group:
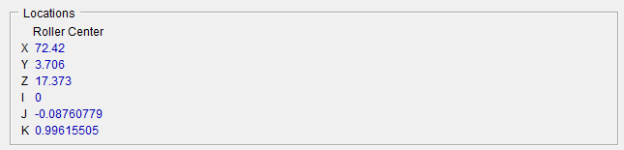
Roller Center — Displays the coordinates of the roller center point and the components of the vector at the roller center point representing the roller axis.
-
X — Displays the X component of the current location of roller center point.
-
Y — Displays the Y component of the current location of the roller center point.
-
Z — Displays the Z component of the current location of the roller center point.
-
I — Displays the I component of the vector at the roller center point representing the roller axis.
-
J — Displays the J component of the vector at the roller center point representing the roller axis.
-
K — Displays the K component of the vector at the roller center point representing the roller axis.
Right-click in a Locations Group displayed in the Status panel to display the following window that enables you specify the features that you want displayed in the Locations Group.

See Right Mouse Menus for more information on how to use this menu.
Time & Distance Group
The following information is available for display in the Time & Distance Group:
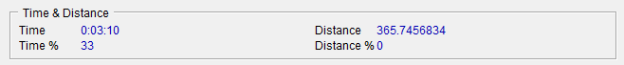
Time — Time anticipated to lay the composite tape for the part (as simulated by Vericut Composite Simulation). To calculate anticipated machining time, Vericut Composite Simulation records the time for tool motions based on specified tape laying feed rates and rapid rates.
Distance — The tool movement distance, in inches or millimeters, depending in the Vericut Composite Simulation session configuration.
Time % — Percentage of time in feed rate mode. This value can be helpful when judging tool path efficiency. For example, a high value suggests an efficient tape laying path, since a value less than 100 percent means that the tape head is moving at rapid feed and is probably not laying down material.
Distance % — Percentage of tool movement distance in feed rate mode. Similar to the Time versus Time % relationship described above, this value can also be helpful when judging tape laying path efficiency.
Right-click in a Time & Distance Group displayed in the Status panel to display the following window that enables you specify the features that you want displayed in the Time & Distance Group.
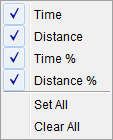
See Right Mouse Menus for more information on how to use this menu.
Others Group

The following information is available for display in the Others Group:
Interpolation — Off / Polar / Cylindrical
Active Tows — Displays the number, and identity, of the currently active tows in the format "6/12 (111111000000)".
Polar Coordinates — Display the status of polar coordinate input (ON/OFF).
Right-click in an Others Group displayed in the Status panel to display the following window that enables you specify the features that you want displayed in the Others Group.
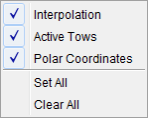
See Right Mouse Menus for more information on how to use this menu.
💡 Tip: You can send status information to a text file. To accomplish this, set the CGTECH_STATUS environment variable to the name of the file before or when Vericut is executed.
Vericut Drill and Fastener Simulation Review Files
The following Status panel features are available in a Vericut Drill and Fastener Simulation review file:
Icon Bar
![]()
The items in the Icon Bar enable you to specify the SubSystem that you want the information in the Status panel to apply to, specify which groups that you want displayed in the Status panel, specify whether you want the Status panel displayed vertically or horizontally, and specify the color that you want the data displayed in.. Holding the cursor over the icon will display a short description of what the icon is used for.
 (SubSystem) — When a machine with more than one subsystem is in use, use this feature to specify which subsystem that you want the information in the Status panel to apply to. Select the Subsystem from the pull-down list.
 (Set Group Visibility) — Click on this icon to display the menu shown below which enables you to specify which information groups you want displayed in the Status panel.
Click in the box next to each information group’s name to toggle between display (checked) and do not display (unchecked). Use the Set All feature to set all information groups to display (checked). Use the Clear All feature to set all information groups to do not display (unchecked). You can select any combination of groups to be displayed in the Status panel. You can change the order of the information groups by clicking in an information group displayed in the Status panel and dragging it to the desired location.
![]() (Tile Groups Horizontally/Vertically) — This icon toggles between Horizontally and Vertically enabling you to specify whether you want to display the Status panel in a vertical orientation or in a horizontal orientation.
(Tile Groups Horizontally/Vertically) — This icon toggles between Horizontally and Vertically enabling you to specify whether you want to display the Status panel in a vertical orientation or in a horizontal orientation.
Click on the  (Horizontally) icon to display the Status panel in a horizontal orientation as shown in the picture below.
Notice that 2 sliders is are added to the Icon Bar as shown in the picture below.

The first slider enables you to adjust the width of the Program column so that you can see the complete records.
The second slider enables you to adjust the width of the Tool column so that you can see the complete records.
Both sliders are only available when the Status window is in a Horizontal orientation.
Click on the ![]() (Vertically) icon to display the Status panel in a vertical orientation as shown in the picture below.
(Vertically) icon to display the Status panel in a vertical orientation as shown in the picture below.

 (Set Value Text Color) — Use this icon display a color palette enabling you to specify the color that you want the information in the Status panel to be displayed in.
The right side of the (Set Value Text Color) icon shows the current color being used for the information in the Status panel. To change the color for the information, click on the (Set Value Text Color) icon to display the color palette window shown below.
Click on a color in the color palette window, to specify the color for the information in the Status panel. The color palette will close and the right side of the  (Set Value Text Color) icon in the Status panel icon bar will update to reflect the selected color.
Close the color palette window without changing the color by clicking on the ![]() in the upper right corner of the color palette.
in the upper right corner of the color palette.
Information Groups
Program Group
The following information is available for display in the Program Group:
SubSystem — When a machine with more than one subsystem is in use, this option controls which subsystem status to show.
NC Program — The name of the current NC program file.
NC Program Rec. # — The line number of the current NC program record.
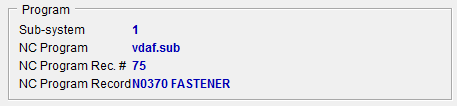
NC Program Record — Current NC Program record being processed. Both the record text and sequential line number in the file are shown.
Right-click in a Program Group displayed in the Status panel to display the following window that enables you specify the features that you want displayed in the Program Group.
See Right Mouse Menus for more information on how to use this menu.
Basic Group
The following information is available for display in the Basic Group:
Errors — Displays the number of errors detected by Vericut Drill and Fastener Simulation during processing. A blank field indicates that no errors were detected. Consult the Log file for details about the errors.
Warnings — Similar to Errors above, except that the number of warnings detected is displayed.
Feedrate — Current programmed feed rate. A blank field indicates no records that control feed rate that have been processed.
Coolant — Current programmed coolant condition. A blank field indicates no records that control coolant that have been processed.
Motion Type — Rapid / Linear / CW / CCW / Thread / Nurbs / Poly
Abs/Inc — Absolute / Incremental
Motion Plane — XY / YZ / ZX
Units — Inch / Metric
Spindle Mode — CSS / RPM
Right-click in a Program Group displayed in the Status panel to display the following window that enables you specify the features that you want displayed in the Program Group.
See Right Mouse Menus for more information on how to use this menu.
Locations Group
The following information is available for display in the Locations Group:
Machine — Current locations of machine axes (X, Y, Z, A, B, C, U, V, W, A2, B2, C2) resulting from processing the current G-Code NC program record. Only the axes that exist for the selected subsystem will be shown.
Local — The display will be similar to the Machine Axes (only showing the axes that exist for the selected subsystem). The contents of the "Local Axes" fields will represent the current axis (X, Y, Z, A, B, C, U, V, W, A2, B2, C2) locations in the local coordinate system. Typically, this will correspond to the values entered in the NC program file (except when specifying machine coordinates, or incremental values).
Tool Tip — Current X Y Z tool tip location and I J K tool axis orientation with respect to the active tool path coordinate system.
Right-click in a Locations Group displayed in the Status panel to display the following window that enables you specify the features that you want displayed in the Locations Group.

See Right Mouse Menus for more information on how to use this menu.
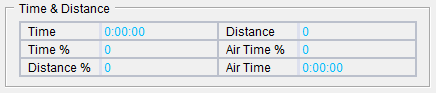
Time & Distance Group
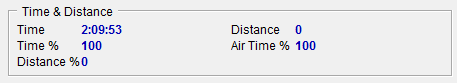
The following information is available for display in the Time & Distance Group:
Time — Time anticipated to lay the composite tape for the part (as simulated by Vericut Drill and Fastener Simulation). To calculate anticipated machining time, Vericut Drill and Fastener Simulation records the time for tool motions based on specified drilling feed rates and rapid rates.
Distance — The tool movement distance, in inches or millimeters, depending in the Vericut Drill and Fastener Simulation session configuration.
Time % — Percentage of time in feed rate mode. This value can be helpful when judging tool path efficiency. For example, a high value suggests an efficient tool path, since a value less than 100 percent means that the tool is moving at rapid feed and is probably not removing material.
Air Time % — The percent of time spent moving air.
Distance % — Percentage of tool movement distance in feed rate mode. Similar to the Time versus Time % relationship described above, this value can also be helpful when judging tool path efficiency.
Right-click in a Time & Distance Group displayed in the Status panel to display the following window that enables you specify the features that you want displayed in the Time & Distance Group.
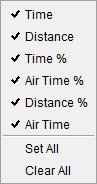
See Right Mouse Menus for more information on how to use this menu.
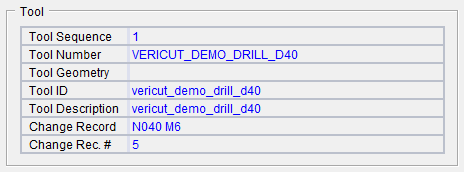
Tool Group
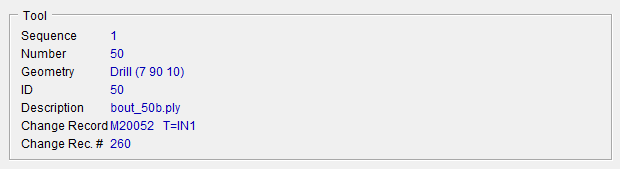
The following information is available for display in the Tool Group:
Sequence — Sequential number of the last tool change event.
Number — Tool number in use (if specified). Examples follow.
| NC program type: | Sample tool chg record: | Status window "Number": |
|---|---|---|
| G-Code data | T10M6 | 10 |
| APT | CUTTER/... | none |
| APT | PPRINT/Vericut-TC... | none |
| APT | LOADTL/1 | 1 |
| UG CLS | LOAD/TOOL,4,... | 4 |
Geometry — Cutter shape geometry. The method used to define the cutter shape is shown in square brackets "[ ]" followed by the description. "PROFILE" indicates a profile type of cutter definition.
ID — ID of a tool retrieved from a Vericut Tool Library file, if any. A blank field indicates the current tool did not come from a tool library. "OVERRIDE" indicates that the current tool has been specified via the Override feature. If the ID differs from the Number field value described above, the tool was specified via a tool list.
Description — Description of a tool retrieved from a Vericut Tool Library file. A blank field indicates a description for this tool was not defined in the library, or the tool did not come from a tool library.
Change Record — The last tool change record processed. Both the record text and sequential line number in the file are shown.
Change Rec. # — The line number of the last tool change record.
Right-click in a Tool Group displayed in the Status panel to display the following window that enables you specify the features that you want displayed in the Tool Group.
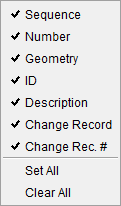
See Right Mouse Menus for more information on how to use this menu.
Others Group
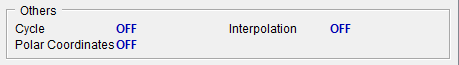
The following information is available for display in the Others Group:
Cycle — OFF / Drill / Face / Deep / Tap /Bore / Mill / Thru / Bore Orient / Bore Drag
Interpolation — OFF / Polar / Cylindrical
Polar Coordinates — Display the status of polar coordinate input (ON/OFF).
Right-click in an Others Group displayed in the Status panel to display the following window that enables you specify the features that you want displayed in the Others Group.
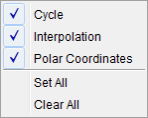
See Right Mouse Menus for more information on how to use this menu.
💡 Tip: You can send status information to a text file. To accomplish this, set the CGTECH_STATUS environment variable to the name of the file before, or when, Vericut is executed.