VCS X-Caliper Features
The following X-Caliper features are only available when using a review file created in Vericut Composite Simulation. If a feature is not listed here, it is shared between the X-Caliper tab of all software and will be explained on the Common Features page.
Peel off Layer
Location: X-Caliper tab >  (Peel off Layer)
When a location on a tape ply is selected, the Peel off Layer command button enables you to make selected composite layers invisible in order to see what is underneath them. When the box is checked, a left mouse click over composite material hides the selected layer. Information about the "peeled-off" layer is displayed below the logger. Up to 32 layers can be "peeled off" simultaneously by consecutive mouse clicks.
When Peel off Layer is selected, the Settings group changes to the following:
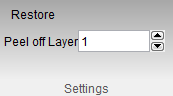
Peel off Layer — Use this text box to select the layer to which the laminate will be peeled.
Restore — Use to restore all peeled off tape layers.
Information
Location: X-Caliper tab >  (Information)
When a location on a tape ply is selected, the Information command button is used to gather information about the NC record that laid it. When a machine model is selected, this option displays information about the machine model.
Sample Vericut Logger panel, X-Caliper tab results:
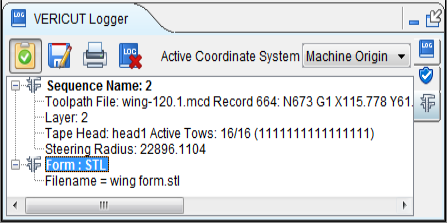
When a location on a composite course is selected, the Information option displays information related tape history. The historical data includes: Tape Layer number, NC program file name, record number and NC program record text responsible for laying the tape, Tape Head that laid the tape, Active Tows and the Steering Radius.
When a machine model is selected, the Information option displays information related to the machine model. The model data includes: component name, model type, and model dimensions or model file name.
Stack Thickness
Location: X-Caliper tab >  (Stack Thickness)
The Stack Thickness command button enables you to determine the composite material layers in the laminate stack, the ply direction of each layer and the thickness of the laminate stack at a specified point.
Sample Vericut Logger panel, X-Caliper tab results:
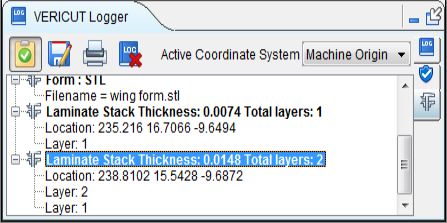
Click anywhere on the composite material to indicate where you want Vericut Composite Simulation to determine the composite material layers in the laminate stack, the ply direction of each layer and the thickness of the laminate stack composite material at the selected point.
Results are displayed in the X-Caliper window. Data output includes the Thickness at the selected point, the Location of the selected point, the ID of Layers at the selected point, the ply angle of each layer, and the total number of layers.
📝 NOTE: In order for the ply angle information to be displayed in the X-Caliper window, there must be a call to the TapeSetPlyAngle macro specifying the ply angle for each ply group. See TapeSetPlyAngle in the Vericut Macros section, in the Vericut Help Library, for a description of this, and all, Vericut macros.
Course Gap/Overlap
Location: X-Caliper tab >  (Course Gap/Overlap)
The Course Gap/Overlap command button is used to analyze gaps and overlaps between courses of composite material.
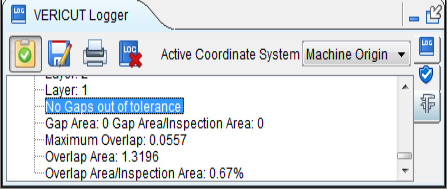
Sample Vericut Logger panel, X-Caliper tab results:
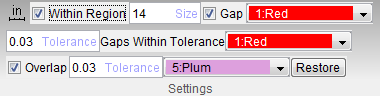
When Course/Gap Overlap is selected, the Settings group changes to the following:
Within Region — When toggled "off", the Tape Gap/Overlap feature enables you to measure individual gaps/overlaps by picking along the edge of a tow in the graphics area. The edge of the tow becomes highlighted and an arrow representing the normal to the edge along which the measurement will be taken. For overlaps, the measurement is taken in the direction opposite of the arrow. For gaps, the measurement is taken in the direction of the arrow. Both the tow edge and the arrow are displayed in the Foreground color (ref. Color window, Define tab in the Configuration tab section of Vericut Composites Simulation Help for additional information). Measurement results are displayed in the X-Caliper window.
When toggled "on", all of the remaining features in this window become active enabling you to analyze all gaps and overlaps within a specified region. A square, representing the region that will be checked, displayed in the Foreground color, tracks along with the cursor. When you left click in the graphics area, X-Caliper checks the region and displays gap and/or overlap information according to your Tape Gap/Overlap settings.
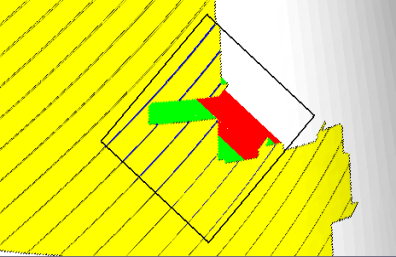
In the picture below:
-
yellow represents the ply
-
white, or light gray, area represents the mandrel
- the black square represents the region boundary
- red represents gaps that exceed the specified tolerance
- green represents the gaps that are within the specified tolerance
- blue represents the tow overlap that exceeds the specified tolerance
Size — Use to specify the size of the region. The number value, specified in the project file's units, is the length of the sides of the square representing the region boundary.
Gap — When toggled "on", X-Caliper will check all gaps within the region boundary.
Tolerance — Use to specify the acceptable gap tolerance value. Use the color list to select the color for displaying gaps that exceed the specified gap tolerance.
Gaps Within Tolerance — Use the color list to select the color for displaying gaps that fall within the specified gap tolerance.
Overlap — When toggled "on", X-Caliper will check all overlaps within the region boundary.
Tolerance — Use to specify the acceptable overlap tolerance value. Use the color list to select the color for displaying overlaps that exceed the specified overlap tolerance.
Restore — Use to clear the region boundary and the gap/overlap display from the graphics area.
Cumulative Gap/Overlap
Location: X-Caliper tab >  (Cumulative Gap/Overlap)
The Cumulative Gap/Overlap command button is used to analyze the sum of gaps or overlaps over a certain distance. A common physical inspection technique involves placing a flexible plastic strip, like a ruler, on a ply. The widths of all the gaps or overlaps under the strip are summed. If the accumulated width of the gaps or overlaps exceeds a limit, some remedial action is required. Very narrow gaps or overlaps can be excluded from the total.
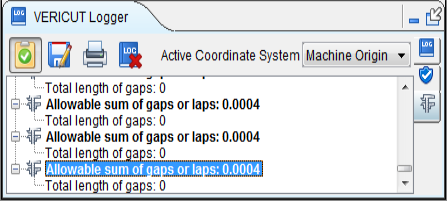
Sample Vericut Logger panel, X-Caliper tab results:
When Cumulative Gap/Overlap is selected, the Settings group changes to the following:
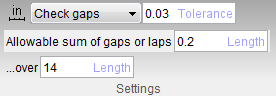
Check gaps/Check overlaps — When set to “Check gaps”, X-Caliper will check for gaps along the strip. When set to “Check overlaps”, X-Caliper will check for overlaps along the strip
Tolerance — Use to specify the acceptable gap or overlap value. Values under this tolerance will not be used.
Allowable sum of gaps or laps — This measurement indicates the maximum amount of space allowed between laminate sections.
Total length of gaps — This measurement indicates the total length of gaps present. If the length exceeds the allowable sum, Vericut Logger states “Total sum exceeds allowable sum. Remediation required to alert you of the problem.”
…over — Use to specify the length of the strip used.
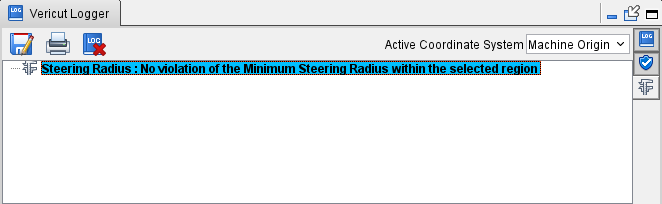
Steering Radius
Location: X-Caliper tab >  (Steering Radius)
The Steering Radius command button is used to analyze tows of composite material, within a specified region, to ensure that they do not violate the Steering Radius value specified in the NC program that laid them.
Sample Vericut Logger panel, X-Caliper tab results:
When Steering Radius is selected, the Settings group changes to the following:
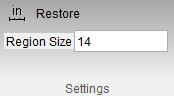
Region Size — Use to specify the size of the region to be used. The number value, specified in the project file's units, is the length of the sides of the square representing the region boundary.
Restore — Use to clear the region boundary and minimum steering radius violations from display from the graphics area.
A square, representing the region that will be checked, displayed in the Foreground color, tracks along with the cursor. When you left click in the graphics area, X-Caliper checks the region and displays areas within the region that violate the Steering Radius in the Error color as shown in the picture below.
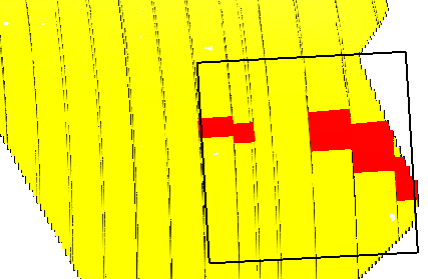
Results for each region checked are displayed in the X-Caliper window. Data output includes the number of NC records, if any, that violate the Steering Radius within the specified region, the value of smallest steering radius found within the region, and the line number and record text of the record in the NC program that laid the tow.
Tow Packet
Location: X-Caliper tab >  (Tow Packet)
The Tow Packet command button is used to analyze individual tows within a selected tow packet. A tow-packet is the portion of a course from the start of a lead-in to the end of a run-out.
Sample Vericut Logger panel, X-Caliper tab results:
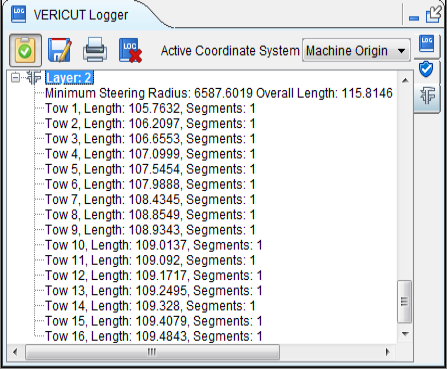
After left-clicking in the location of interest in the graphics area, the tow packet boundary is displayed in the Foreground color as shown below.
The resulting information for the tow packet is displayed in the X-Caliper window. Data output includes the layer/sequence that the tow packet is part of, the Minimum Steering Radius within the tow packet boundary, the overall length of the tow packet, and the length and number of segment for each tow in the tow packet.
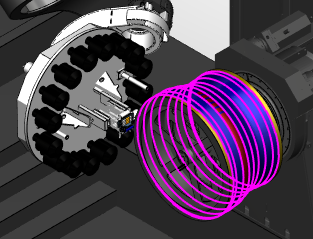
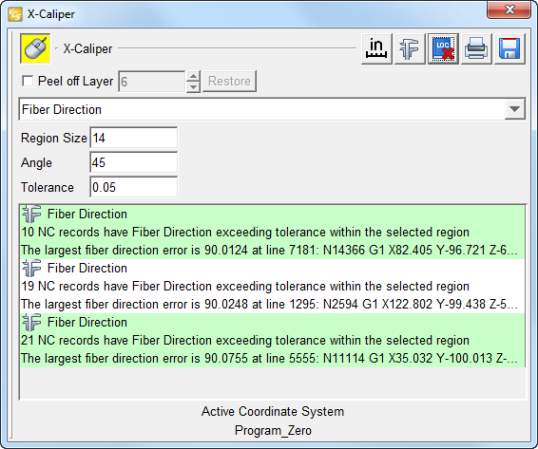
Fiber Direction
Location: X-Caliper tab >  (Fiber Direction)
The Fiber Direction command button is used to analyze the courses in the top-most layer that lie within a specified region are sampled and measured against a specified angle and tolerance value. Any course segments whose angles are outside the specified tolerance are highlighted red, and their deviation from the desired angle is displayed in the X-Caliper window.
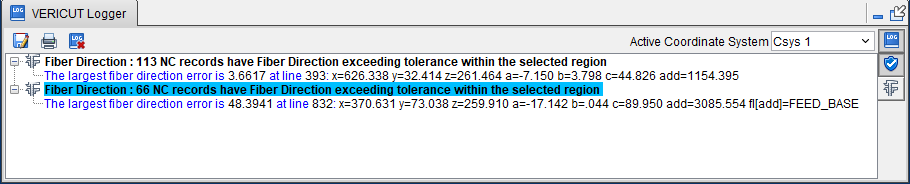
Sample Vericut Logger panel, X-Caliper tab results:
The "fiber direction" is the direction of the path relative to a selected coordinate system, known as a "rosette". In Vericut Composite Simulation the "rosette" is always the "active" coordinate system. When determining the "fiber direction, the "rosette" coordinate system is translated to the pick point and projected onto the surface of the material as shown in the picture below.
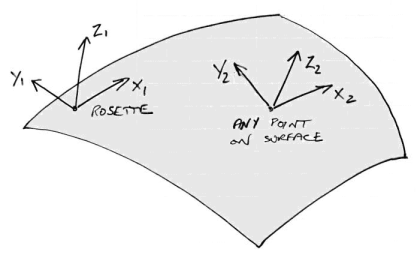
By definition, the rosette's X-axis corresponds to a ply angle of zero degrees. Positive ply angles are measured from the translated rosette's X-axis, counter-clockwise about the Z-axis (towards the Y-axis).
When Fiber Direction is selected, the Settings group changes to the following:
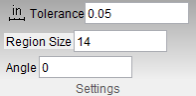
Tolerance — Use to specify the tolerance value that the fiber direction can deviate from the specified Angle.
Region Size — Use to specify the size of the region to be used. The number value, specified in the project file's units, is the length of the sides of the square representing the region boundary.
Angle — Use to specify the fiber direction angle.
A square, representing the region that will be checked, displayed in the Foreground color, tracks along with the cursor. When you left click in the graphics area, X-Caliper checks the region and displays areas within the region that fall outside of the specified angle and tolerance in the Error color as shown in the picture below.
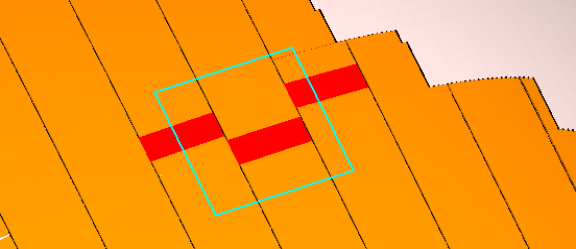
Results for each region checked are displayed in the X-Caliper window. Data output includes the number of NC records, if any, that fall outside of the specified angle and tolerance within the specified region, the value of largest fiber direction deviation found within the region, and the line number and record text of the record in the NC program that laid the tow.
Stagger
Location: X-Caliper tab >  (Stagger)
The Stagger command button is used to measure the course stagger (minimum offset distance) between layers of same “fiber direction”.
Sample Vericut Logger panel, X-Caliper tab results:
Course stagger is the offset distance (measured across the layup surface) between course edges of same-direction layers, all the way through the laid-up laminate as shown in the example in the picture below. The red plies indicate the plies with the same “fiber direction”.
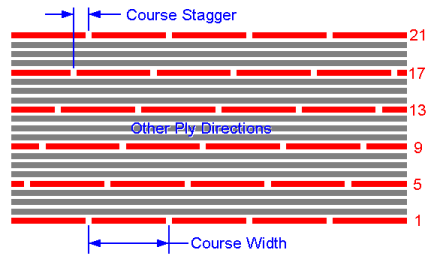
Course stagger is used to prevent the course edges in one layer, and the edges of courses parallel to and on top of it to not lie on top of each other. The course edges must be a "minimum offset distance" away from each other.
The calculation of stagger is done between the top most layer (the initial pick) and all previously applied layers that have a fiber direction that is the same (within the "Forward Direction" tolerance specified in Tape Manager) as the direction set by the initial pick.
One of two type of information for each pick point will be displayed in the X-Caliper Stagger window.
-
“Not enough tape layers at this point” indicates that the layer picked is the only layer with this "fiber direction"
-
“Picked layer {layer} with direction of {angle} degrees.”
“Stagger between layers {layer1} and {layer2}: {stagger distance}”
The second line will be output for each pair of layers that have the same "fiber direction")
For example:
Picked layer 5 with direction of 90.000000 degrees
Stagger between layers 5 and 1: 0.0626