Preferences
Location:
File tab > Preferences
The Preferences button opens the Preferences window enabling you to specify the project file that you want displayed when you start the next session, the number of "recent files" that you want Optimizer to remember, and the PDF reader/web browser that you want Optimizer to use for online Help.
Start-up tab
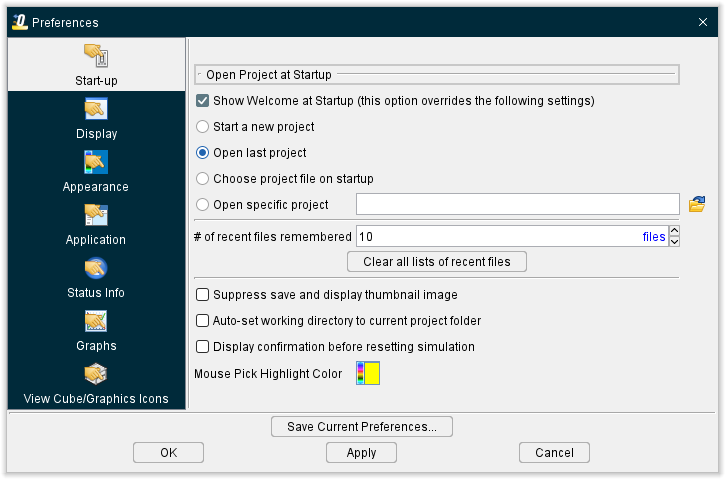
Show Welcome at Startup (this option overrides the following settings) — When toggled "on", this will display the Welcome Screen when Optimizer is opened. Having this feature active means the next four features will not be active at Startup.
Start a new project — When toggled "on", the session opens and displays the New Project window enabling you to specify information related to the new project file to be created. This is the default preferences setting for the software.
Open last project — When toggled "on", the new session opens with the same project file that was open when you closed the previous session.
Choose project file on startup — When toggled "on", Optimizer displays the Open Project window at startup enabling you to select a project file.
Open a specific project — When toggled "on", designates your selected project file as the file the software will always open with.
# of recent files remembered — Use this feature to specify the number of "Recent Files" that you want Optimizer to remember and display.
Clear all lists of recent files — Use this feature to clear all "Recent Files" lists. This includes the "Recent Files" lists in the File menu in the main window, Report Template window, and in the Inspection Sequence window.
Suppress save and display thumbnail image — When toggled “on” (checked), the saving of a thumbnail image when the project file is saved, and the display of the thumbnail image in the Open Project file selection box, are both suppressed.
Auto-set working directory to current project folder — When toggled “on” (checked), Optimizer automatically sets the Working Directory to the folder that the “current” project file was located in.
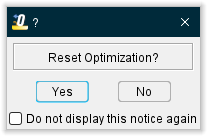
Display confirmation before resetting simulation — When toggled “on” (checked), generates a confirmation window when the simulation is reset.
Clear Log File on reset — When toggled “on” (checked), the Log File will be cleared whenever you do a Reset Model.
Use Project File Name for Log File Name — Once this feature is toggled on (checked), the user will no longer see the default log name in the working directory. Instead there will be a project_name.log instead. The setting of this feature is saved in the preferences file.
Mouse Pick Highlight Color — Use the  (Color Palette) icon to specify a color for the “Mouse Pick” indicator
  . The right side of the (Color Palette) icon shows the current color for the “Mouse Pick” indicator. To change the color of the “Mouse Pick” indicator, click on the (Color Palette) icon to display the color palette window shown below.
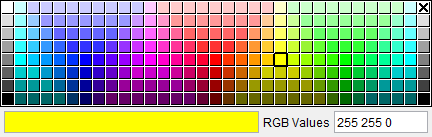
Click on a color in the color palette window, to specify the color for the “Mouse Pick” indicator. The color palette will close and the right side of the  (Color Palette) icon in the Preferences window: Start –up tab will update to reflect the selected color.
To close the color palette window without changing the color, click on the  in the upper right corner of the color palette.
Display tab
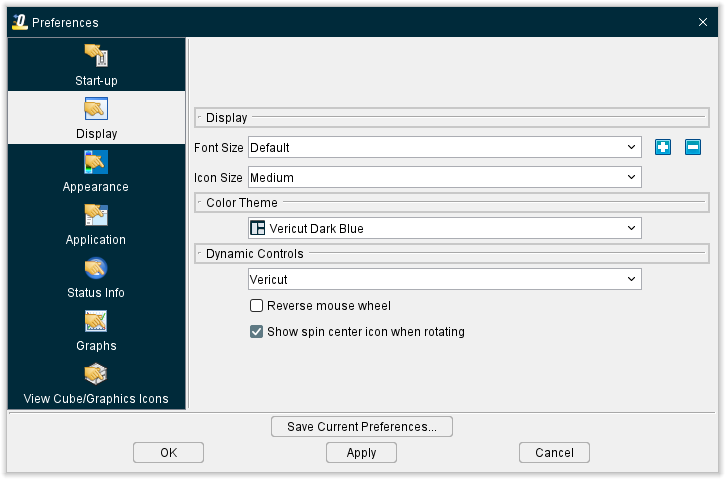
Font Size — The Font Size features enable you to change the size if the font for all text used in Optimizer. Select the desired text size from the pull-down list. Options are Default, Small, Medium, or Large.
-
 (Text Larger) — Use the Text Larger icon to make the text in Optimizer larger. Each time you click on the Text Larger icon, the text gets incrementally larger to a maximum font size of approximately “24 point”.
 -
 (Text Smaller) — Use to make the text in Optimizer menus, message logger, windows, etc. smaller. Each time you click on "Text Smaller", the text gets incrementally smaller to a minimum font size of approximately "6 point".
Icon Size — The icons used throughout Optimizer are available in three different sizes: Small, Medium, and Large. The following features enable you to select the icon size used in Optimizer. A checkmark next to the feature indicates the current selection.
Color Theme
The Color Theme feature enables you to select a “favorite” color for the display of the Main window and dialogs. Select the desired color from the Color Theme pull-down list.
Dynamic Controls
The Dynamic Controls option enables you to use the same mouse actions while in Optimizer, that are required to perform dynamic pan, zoom or rotate in each of the supported CAD systems. This parameter is saved in the Preferences file.
-
CATIA — Use the CATIA mouse action conventions for dynamic pan, zoom and rotate.
-
Creo — Use the Creo mouse action conventions for dynamic pan, zoom and rotate.
-
EdgeCAM — Use EdgeCAM mouse action conventions for dynamic pan, zoom and rotate.
-
GibbsCAM — Use GibbsCam mouse action conventions for dynamic pan, zoom and rotate.
-
hyperMILL — Use the hyperMILL mouse action conventions for dynamic pan, zoom and rotate.
-
MasterCAM — Use the MasterCAM mouse action conventions for dynamic pan, zoom and rotate.
-
NX — Use Siemens NX mouse action conventions for dynamic pan, zoom and rotate.
-
Power MILL — Use the Power Mill mouse action conventions for dynamic pan, zoom and rotate.
-
SOLIDWORKS — Use the SOLIDWORKS mouse action conventions for dynamic pan, zoom and rotate.
-
Top Solid — Use the Top Solid mouse action conventions for dynamic pan, zoom and rotate.
-
Top Solid 7 — Use the Top Solid 7 mouse action conventions for dynamic pan, zoom and rotate.
-
Vericut — Use the Vericut standard mouse action conventions for dynamic pan, zoom and rotate.
Reverse Mouse Wheel — Toggle On/Off to reverse the action of mouse wheel motion.
Show spin center icon when rotating — Toggle On/Off to display the spin center icon during rotations.
Appearance tab
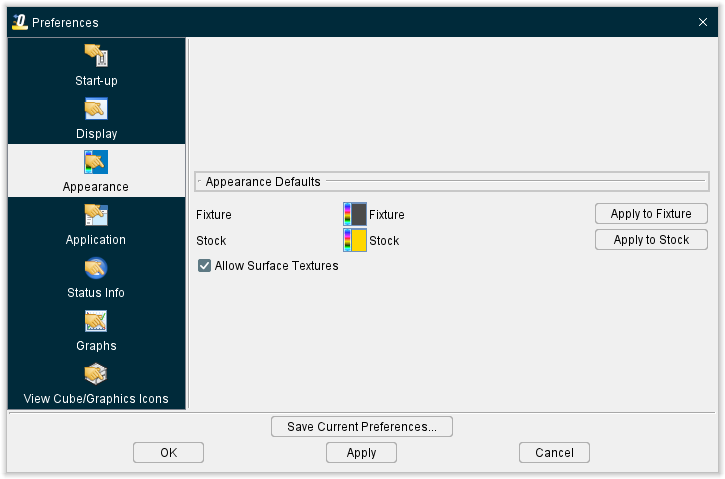
Fixture — use this feature to set the display color for fixture elements.
Stock — use this feature to set the display color for stock elements.
Apply to buttons — use the button on the same line as the element (for instance: Stock line and Apply to Stock button) to make the color show up in the graphics window immediately.
For all color selections, Use the (Color Palette) icon next to each of the features to specify a color for the particular feature.
The right side of the (Color Palette) icon shows the current color for the feature. To change the color of the feature, click on the (Color Palette) icon to display the color palette window shown below.
Click on a color in the color palette window, to specify the new color for the feature. The color palette will close and the right side of the (Color Palette) icon next to the feature will update to reflect the selected color.
To close the color palette window without changing the color, click on the in the upper right corner of the color palette.
Application tab
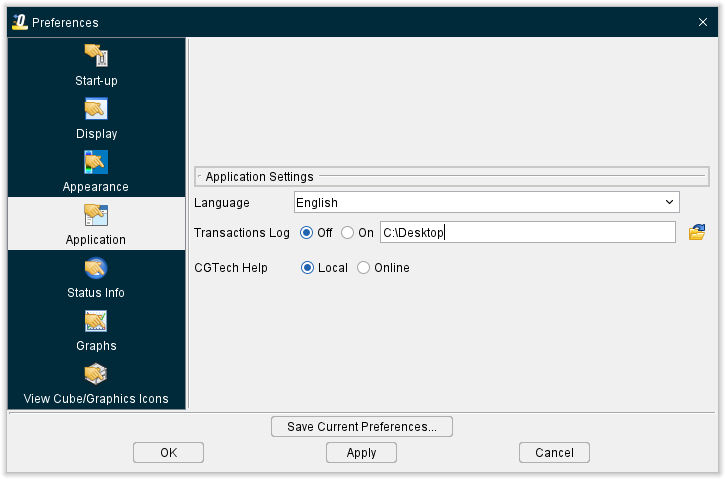
Language — Use this dropdown menu to specify which language you want the software to run in. Current options include: English, Chinese, Czech, French, German, Italian, Japanese, Korean, Portuguese, and Spanish.
Transactions Log — When toggled on (checked), this feature stores a complete log of your sessions in a location of your choice as designated via the location field to the right of the toggle. When toggled off (not checked), no log will be saved.
CGTech Help — Toggle between accessing a Local saved copy of Optimizer's Help documentation or an Online version that updates weekly.
Status Info tab
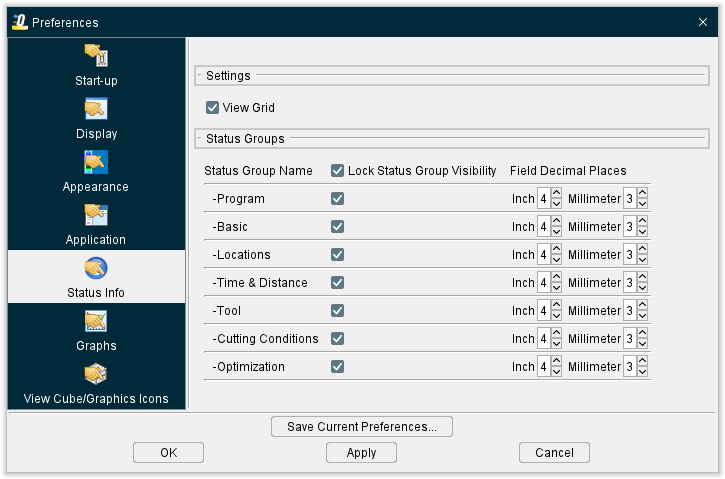
Settings group
View Grid — This feature is on (checked) by default, the Status window data is neatly arranged into tables having visible grid lines. Turning this option off (unchecked) omits the grid lines to provides a more “spacious” Status window appearance.
Status Group Name — This column specifies the status group. This column cannot be edited.
Lock Status Group Visibility — Use the toggles in this column to control whether or the field is visible. More info about each of these Groups can be found in the Status Panel page of the Help.
Field Decimal Places — Use the fields in this column to control how many decimal places display for inch and millimeter measurements. By default, Optimizer sets the display to 4 decimal places for both.
Graphs tab
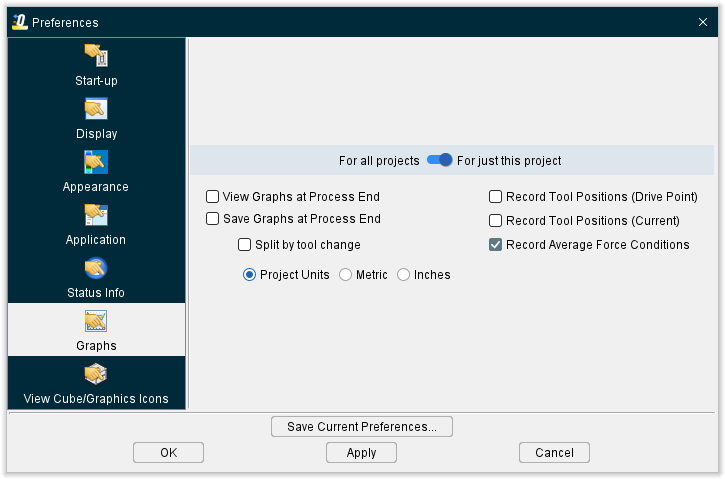
For all projects / For just this project — Use this switch to choose between applying your preferences globally or only to the current project you have loaded.
-
For all projects shows the graph preferences shared between all projects that also have this toggled, similar to the rest of the preferences in the other tabs.
-
For just this project shows only the graph settings for the currently opened project. When a project is saved, these settings will also be saved. They will not apply to other projects. This setting is toggled on by default.
View Graphs at Process End — When toggled on (checked), opens the Graphs window after Optimize Control has been applied and the simulation is run. This feature is available on all Modes except for Air Cuts Only.
Record Tool Positions (Drive Point) — When toggled on (checked), this saves tool positions to your .prefs file which increases the file size but can be useful for certain projects. This adds “Driven Point” position and axis information columns to CSV output data.
Record Tool Positions (Current) — When toggled on (checked), this saves tool positions to your .prefs file which increases the file size but can be useful for certain projects. This adds “Current” position and axis information columns to CSV output data.
Save Graphs at Process End — When toggled on (checked), saves the Graphs at the conclusion of simulation. This feature is available on all Modes except for Air Cuts Only.
Split by tool change — When toggled on (checked), Optimizer saves individual CSV files for each tool that was analyzed or optimized. This option is available when "Save Graphs at Process End" is toggled on (checked). This feature is available on all Modes except for Air Cuts Only.
Record Average Force Conditions — When toggled on (checked), this saves force conditions to the .prefs file. This option is toggled on by default.
Project Units — Select between metric and inches options to set which format units the Graphs window will utilize.
View Cube tab
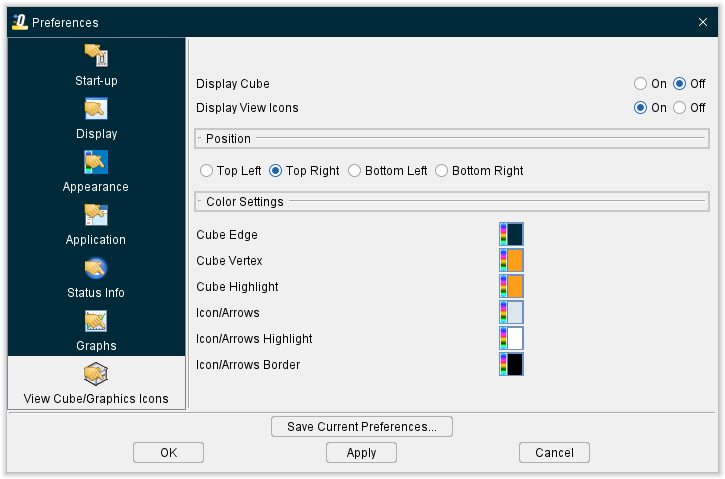
Display Cube — Use this feature to turn the display of the View Cube On or Off.
Color Settings — The Color Settings feature enables you to specify a color for each of the View Cube features described below.
Use the (Color Palette) icon next to each of the View Cube features to specify a color for the particular feature.
The right side of the (Color Palette) icon shows the current color for the View Cube feature. To change the color of the feature, click on the (Color Palette) icon to display the color palette window shown below.
Click on a color in the color palette window, to specify the new color for the feature. The color palette will close and the right side of the (Color Palette) icon next to the View Cube feature will update to reflect the selected color.
To close the color palette window without changing the color, click on the in the upper right corner of the color palette.
Cube Edge — Use this feature to specify a color for the View Cube’s edges as shown in the picture below.
Cube Vertex — Use this feature to specify a color for the View Cube’s vertices as shown in the picture below.
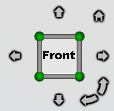
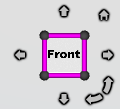
Cube Highlight — Use this feature to specify a highlight color for the View Cube’s edges and vertices. Holding the cursor over an edge or vertex will change the color of the entity to the highlight color so that you can see exactly which entity you are about to select as shown in the pictures below.
| Highlighted Edge | Highlighted Vertex |
|---|---|
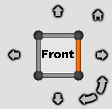 |
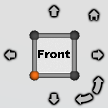 |
Icon/Arrows — Use this feature to specify a color for the View Cube’s icons and arrows as shown in the picture below.
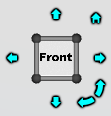
Icon/Arrows Highlight — Use this feature to specify a highlight color for the View Cube’s icons and arrows. Holding the cursor over an icon or arrow will change the color of the entity to the highlight color as shown in the pictures below. Notice how the Home icon is white because it is being hovered over while the arrows remain blue.
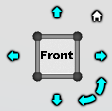
Icon/Arrows Border — Use this feature to specify a border color for the View Cube’s icons and arrows. Holding the cursor over an icon or arrow will change the color of the entity to the highlight color as shown in the pictures below.
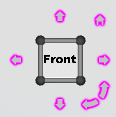
Icon/Arrows Border — Use this feature to specify a border color for the View Cube’s icons and arrows. Holding the cursor over an icon or arrow will change the color of the entity to the highlight color as shown in the pictures below.
Putting it all together you get a View Cube window that looked like the picture below.