Optimizer Logger
The Optimizer Logger, also known as the “message logger” or “logger”, is located below the graphics area, and is the central location for all error, warning, and information messages as well as displaying X-Caliper measurement information.
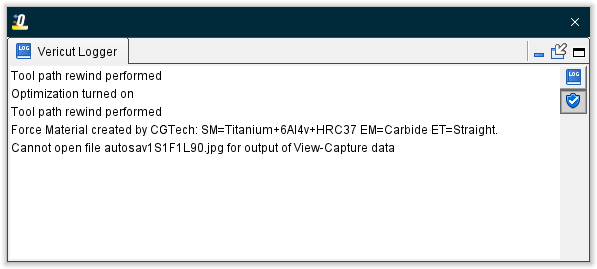
The Logger is one of the "dockable" features enabling you to be able to re-position it if you choose.
The Logger panel consists of four tabs, accessed using the four icons located on the right side of the Logger panel. Each of these tabs is described in detail below.
 Logger — Logger tab displays the most recent messages that Optimizer has provided. Optimizer provides error, warning, and informational messages to assist you during a simulation session.
You can easily determine the type of message by the following:
Error messages are preceded by "Error:". In general, error messages indicate that a problem has occurred that will definitely affect the desired result. If the Use Color feature described in the right mouse button menu section below is active, error messages are displayed in red text as shown in the picture above.
Warning messages are preceded by "Warning:". In general, warning messages indicate that a potential problem situation exists but Optimizer is unable determine whether the situation is critical in your particular environment. If the Use Color feature described in the right mouse button menu section below is active, warning messages are displayed in blue text as shown in the picture above.
📝 NOTE: What is considered an "error" and what is considered a "warning" is often interpret differently from shop to shop, as well as from machine to machine. It is best to evaluate both "errors" and "warnings" in the context of your machining environment regardless of the label used.
Information messages have no preceding label and provide information about various conditions, or states, related to processing. Information messages are always displayed in black text.
You can control the number of messages displayed in the Logger at any one time by clicking on the divider between the Logger and the Graphics Area and either dragging up to increase the number message lines displayed , or down to reduce the number message lines displayed.
You can always use the scroll bar to view messages that are not currently visible in the Logger window.
💡 Tips:
-
If the NC Program panel is open, clicking on an error in the Logger will highlight the NC program record that caused the error.
-
If the NC Program panel is not open, double clicking on an error in the Logger will open the NC Program window with the NC program record that caused the error highlighted.
- Use the F1 key for Help on the Logger. Whether the Logger is docked, or undocked, simply click in the message area to give it focus, and then press F1.
↘️ Shortcut: Right-click in the Logger to display a menu with the following features:
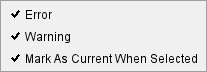
When these features are set before the simulation, only the selected type of information will be written to the Logger. These features can also be used after the simulation to add or remove information displayed in the Logger.
Error — When toggled "On" (checked), error messages will be written out to the Logger.
Warning — When toggled "On" (checked), warning messages will be written out to the Logger.
Mark As Current When Selected — Use this feature to make the highlighted message(s)
Pick a number of individual messages for copying by holding the Ctrl key down while picking messages.
Pick a range of consecutive messages by selecting the first message in the range, and then hold the Shift key down while selecting the last message in the desired range. All of the messages between two messages that you selected will become highlighted.
 Analyze Messages — The Analyze Messages tab displays all messages in sorted tree structure. This message area is NOT continually updated while Optimizer is processing. The information on this tab gets updated each time that the
  “busy” status light in the Animation Controls s turned off.
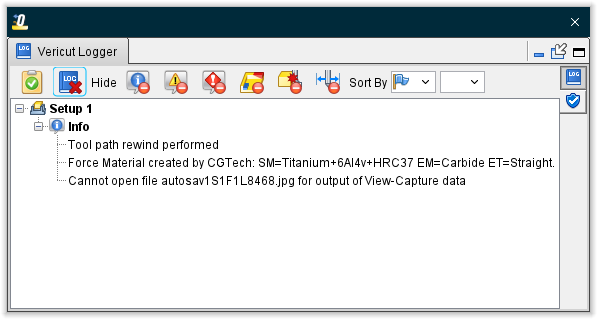
You can click on any of the error or warning messages to be navigated to the relevant portions of the Tool Use panel and the NC Program code for where these occurred.
Analyze Messages Toolbar
The features in the Analyze Messages Toolbar enable you to turn on NC Program Review, clear the messages from the Logger and Analyze Messages tabs, filter out message types that you do not want displayed and sort the messages.

Each of the Analyze Messages Toolbar features is described below.
 NC Program Review — Use this icon to put Optimizer in NC Program Review mode.
 Mark As Current Record When Selecting a Message in Review —
 Clear — Use this icon to immediately clear the information from the Logger and Analyze Messages tabs. Using this feature only clears information from the Logger and Analyze Message tabs, not from the Log file.
Hide features — The Hide features enable you to hide certain types of messages from the Analyze Messages tree structure.
 Hide All Information Messages — Click on the (Hide All Information Messages) to NOT display Information messages in the Analyze Messages tree structure. The icon becomes highlighted
  when active. Click on the highlighted icon to redisplay Information messages in the Analyze Messages tree structure.
 Hide All Warning Messages — Click on the (Hide All Warning Messages) icon to NOT display Warning messages in the Analyze Messages tree structure. The icon becomes highlighted
  when active. Click on the highlighted icon to redisplay Warning messages in the Analyze Messages tree structure.
 Hide All Error Messages — Click on theHide All Error Messages to NOT display Error messages in the Analyze Messages tree structure. The icon becomes highlighted
  when active. Click on the highlighted icon to redisplay Error messages in the Analyze Messages tree structure.
 Hide All Gouge Errors — Click on the (Hide All Gouge Errors) icon to NOT display Gouge Error messages in the Analyze Messages tree structure. The icon becomes highlighted
  when active. Click on the highlighted icon to redisplay Gouge Error messages in the Analyze Messages tree structure.
 Hide All Collision Errors — Click on the (Hide All Collision Errors) icon to NOT display Collision Error messages in the Analyze Messages tree structure. The icon becomes highlighted
  when active. Click on the highlighted icon to redisplay Gouge Error messages in the Analyze Messages tree structure.
 Hide All Travel Limit Errors — Click on the (Hide All Travel Limit Errors) icon to NOT display Travel Limit Error messages in the Analyze Messages tree structure. The icon becomes highlighted
  when active. Click on the highlighted icon to redisplay Travel Limit Error messages in the Analyze Messages tree structure.
Sort By features — The Sort By features provide you with the ability sort messages by multiple criteria. Currently, three sorting types are available:  Sort by Message Type,
  Sort by Tool,
  Sort by NC Program. Select the desired sort type from the pull-down list.
Message sorting is done by the defined sorting criteria starting from the left and moving to the right in the Sort By section of the Analyze Messages Toolbar.
For example, if you have, Sort by NC Program as the first sort criteria, Sort by Tool the as second sort criteria, and Sort by Message Type as the third sort criteria, the messages are sorted by NC program, then by tool and then by message type.